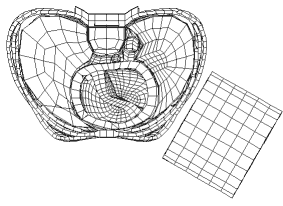

 Figure 1: The left illustration is a typical lateral pendulum impact simulation
of the whole model. The head, neck, shoulder, lower torso and extremities
were lumped to the adjacent regions of the spine and the upper three ribs.
The right illustration is a cross-sectional view of the model at the level
of lower sternum. It shows the skeletal components of the rib cage, the
left and the right lungs, the heart in the mediastinum, the descending
aorta, and the esophagus.
|


