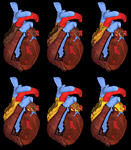
 Figure 3: Excitation propagation in a model of the heart of the Visible
Man: 3D views show the excitation process at different times for the atria.
The color code on the surface describes the value of the transmembrane
potential. The potential decreases from 20 mV to -80 mV changing its color
from yellow, over green, blue to the original color of the cardiac tissue.
|


