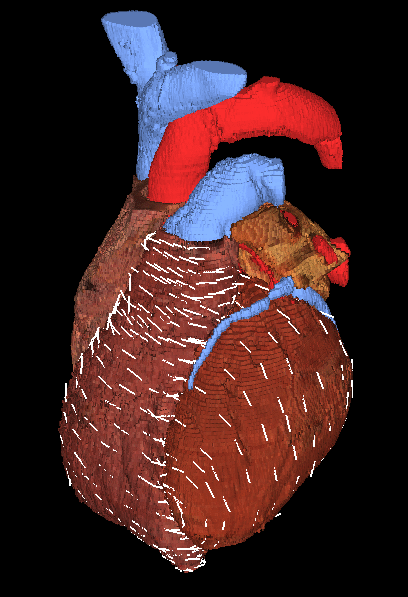
Figure 3: Distribution of electrical field created by cardiac sources at
time of atrial excitation from ventral and lateral. The field is color
coded on the heart surface and on lines, which are constructed by following
the potential gradient.
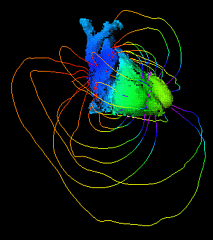
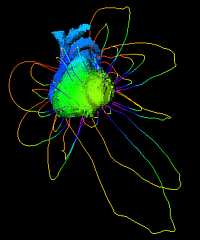
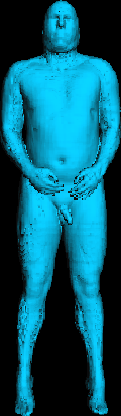
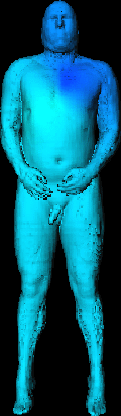
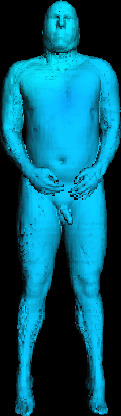
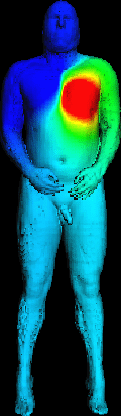
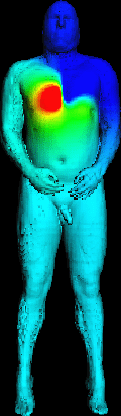
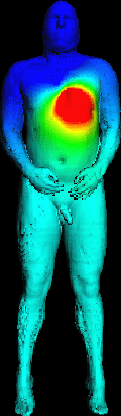
Figure 4: Body surface potential map at different times.
The potential is color coded onto the body surface. The distribution of
the electrical field is computed with numerical methods outgoing from cardiac
sources. Upper row: The left picture shows the body surface potential map
at time of starting cardial excitation at the sinus node. The middle picture
presents the potential distribution at time of ongoing excitation of atriae.
The right picture demonstrates the starting excitation of the septum. Lower
row: The left picture shows the body surface potential map at time of ongoing
excitation of the ventricles. The middle picture presents the potential
distribution at time of excitation of upper parts of the ventricles. The
right picture demonstrates the repolarisation of the ventricles.
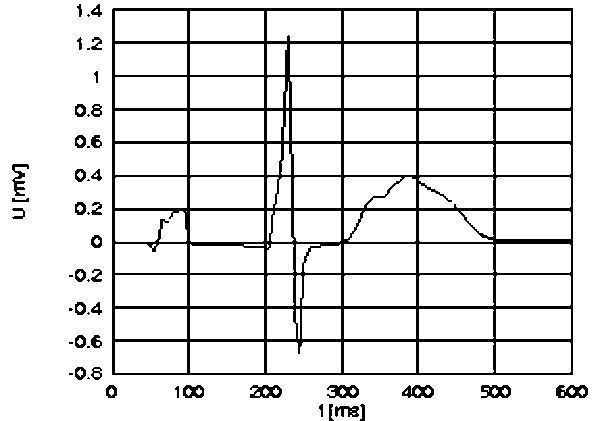
Figure 5: Simulated electrocardiogram: Einthoven limb lead I. The
presented methods can be applied for diagnostic and educational purposes
in electrocardiology. It is possible to include pathologies to study their
influence of and their visibility in the body surface potential maps and
electrocardiograms.