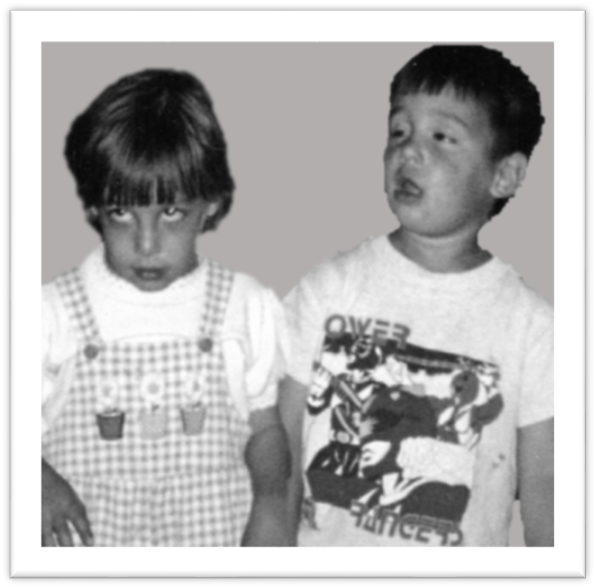
Case Study: Alexis & Noah

Welcome to Your Patients!
Researching the Referral
As their conditions were not really resolved with the initial diagnosis, and have actually gotten worse, they are now being referred to genetic testing to identify the precise lesion and thus their disorder. If a known pathogenic genetic variant is found with the testing, it could validate the initial diagnosis or could provide additional patient-specific information that might provide alternative diagnostic criteria which, we hope, will help to better customize and optimize their case management plans.
To learn more about a case, please click on the Referral icon to open the form.

In the Patient Case Review guide sheet provided by your attending: Notate some key clinical features listed for Jeff as well as a preliminary diagnosis.
This is the beginning of preparing for a possible molecular case presentation.
dystonia AND spasticity AND hyperactivity AND sleep disturbance
 If you need it, you can click here to get to a direct link for the Medgen record page.
The "Disease Characteristics" section of this record displays a summary from a specific GeneReviews® Chapter on the NCBI Bookshelf.
In the Patient Case Review guide sheet: Notate your preliminary diagnosis.
What other disorders might you consider in your differential assessment?
To begin your patients' work-up, go back up in the "Diagnosis" section to learn about laboratory test(s) often ordered to diagnose this particular condition.
(Hint: Check what it says about CSF neurotransmitters and pterins.)
Read the report to learn more about the twins' results.
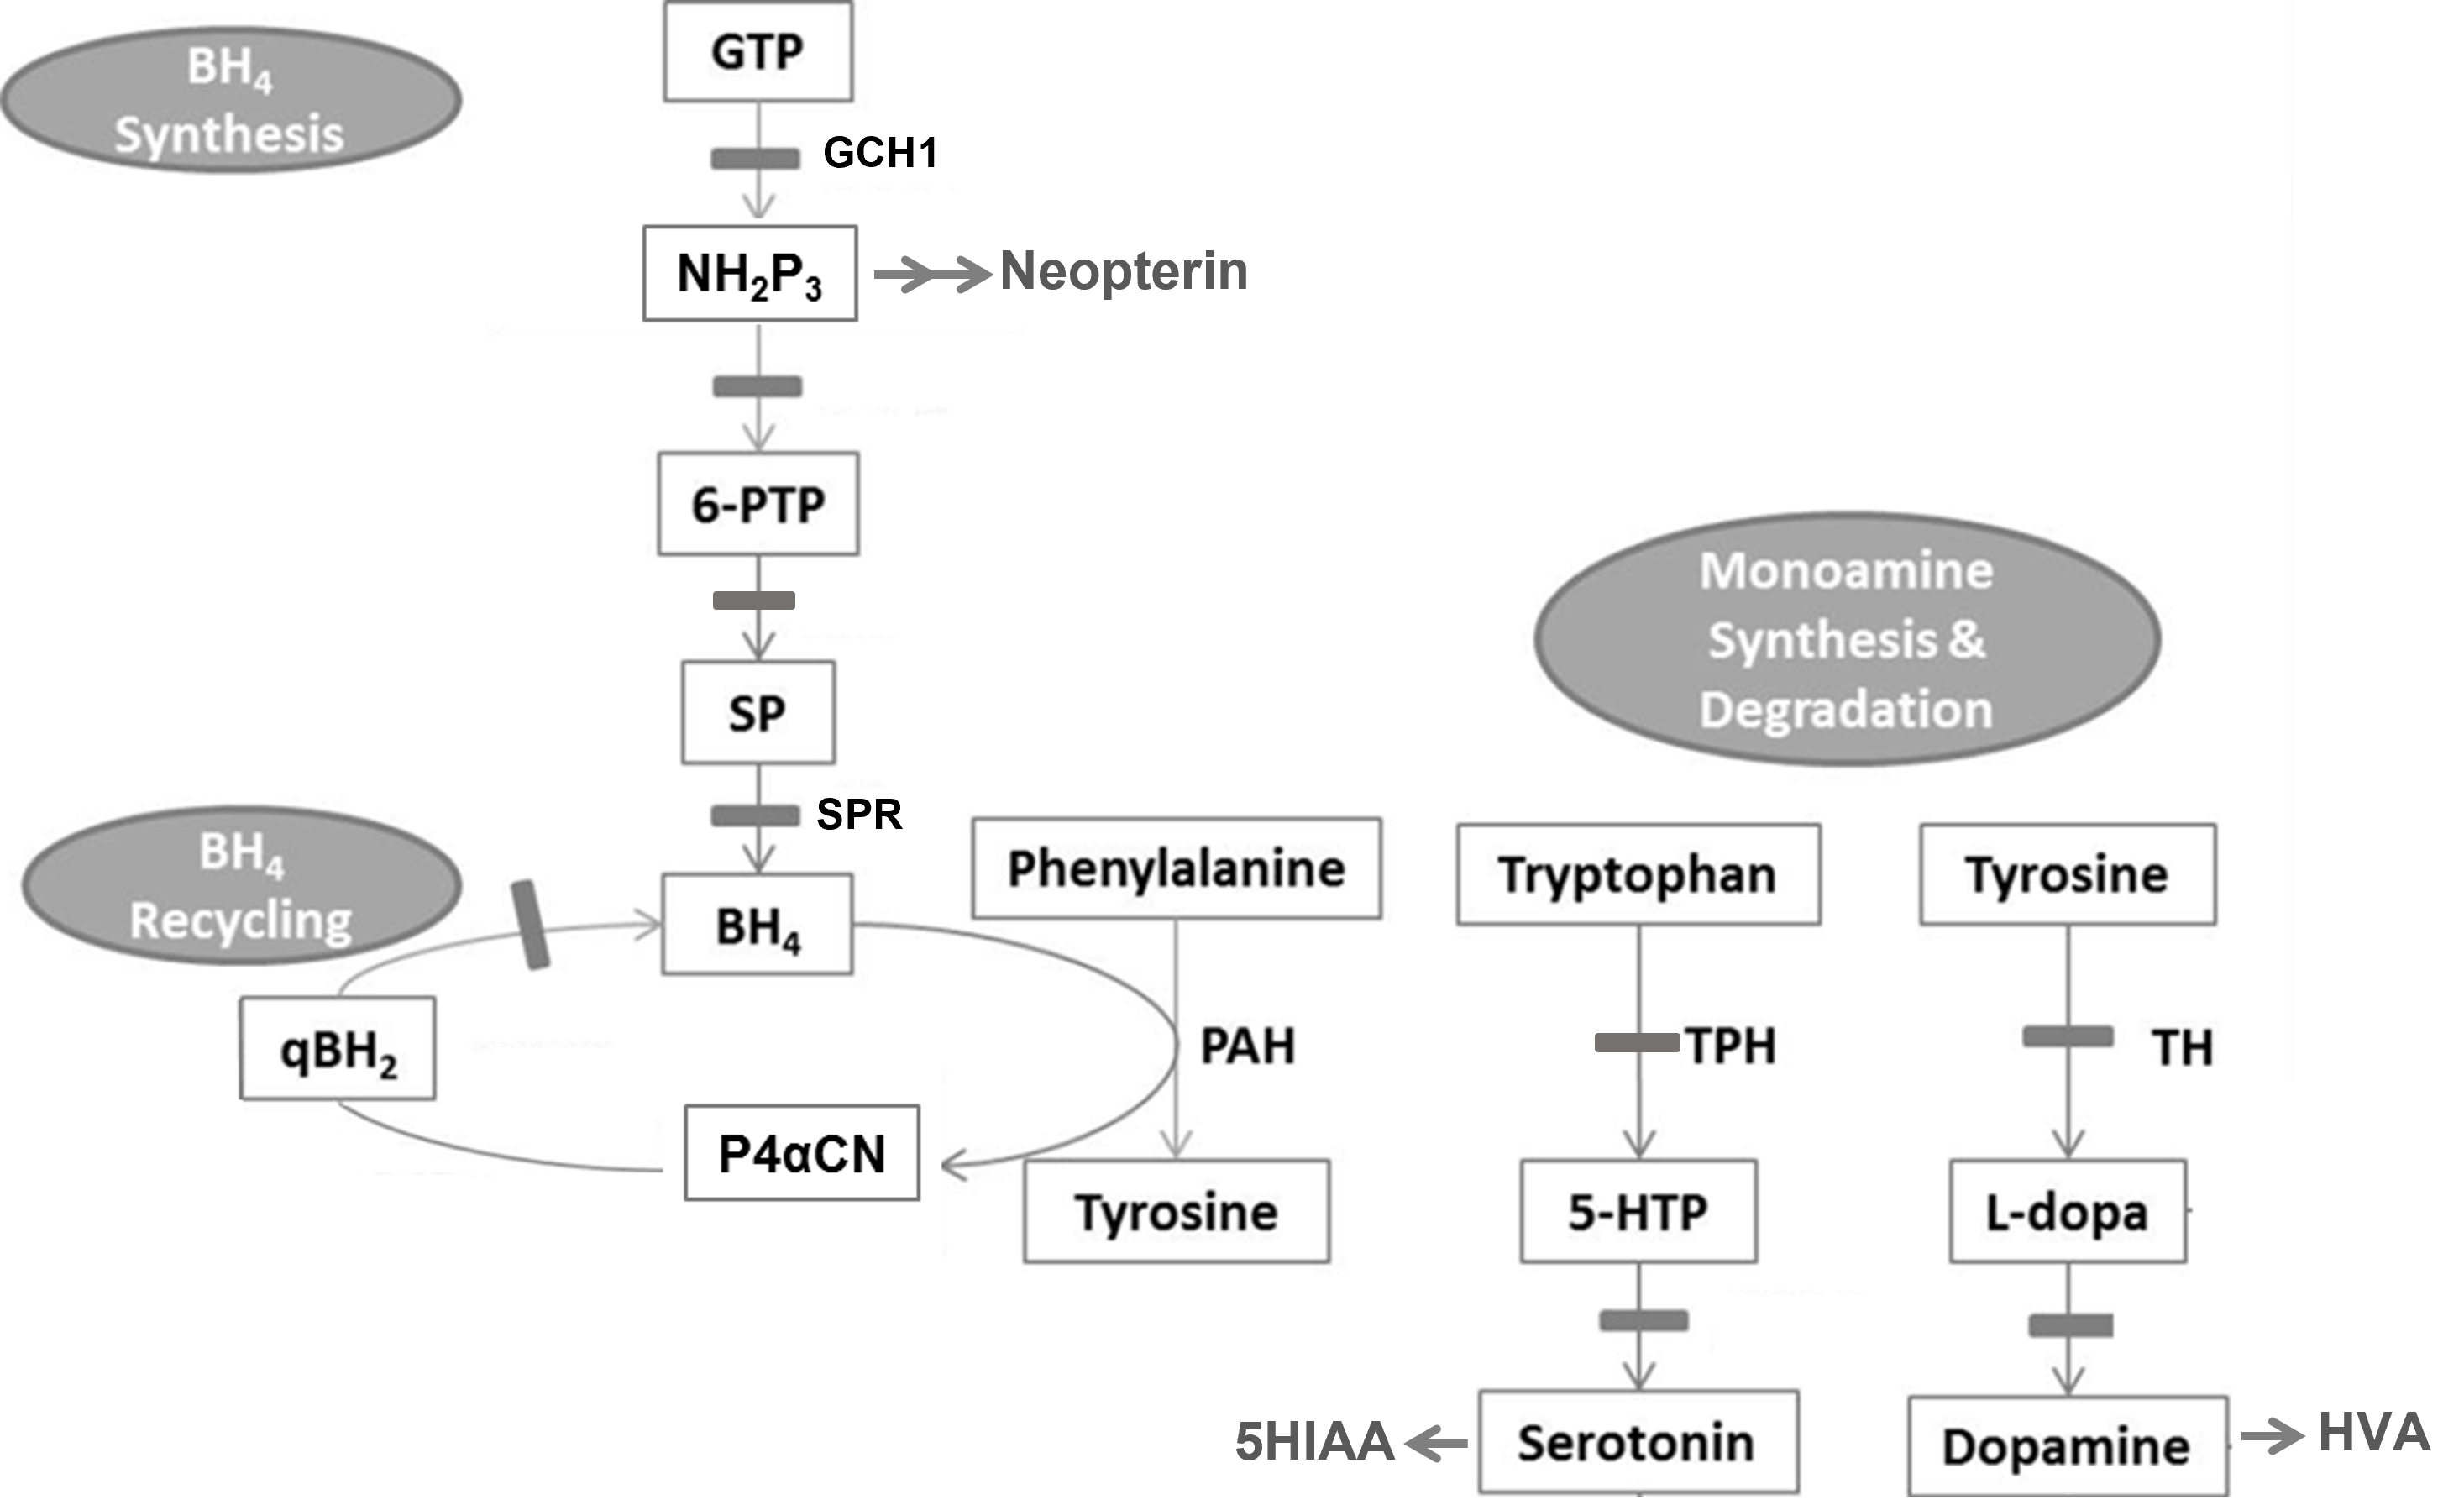
Take a look here at some information that I've pulled it together from an old molecular biology textbook available on the NCBI Bookshelf!
Do the lab and genetic test results both support your initial diagnosis?
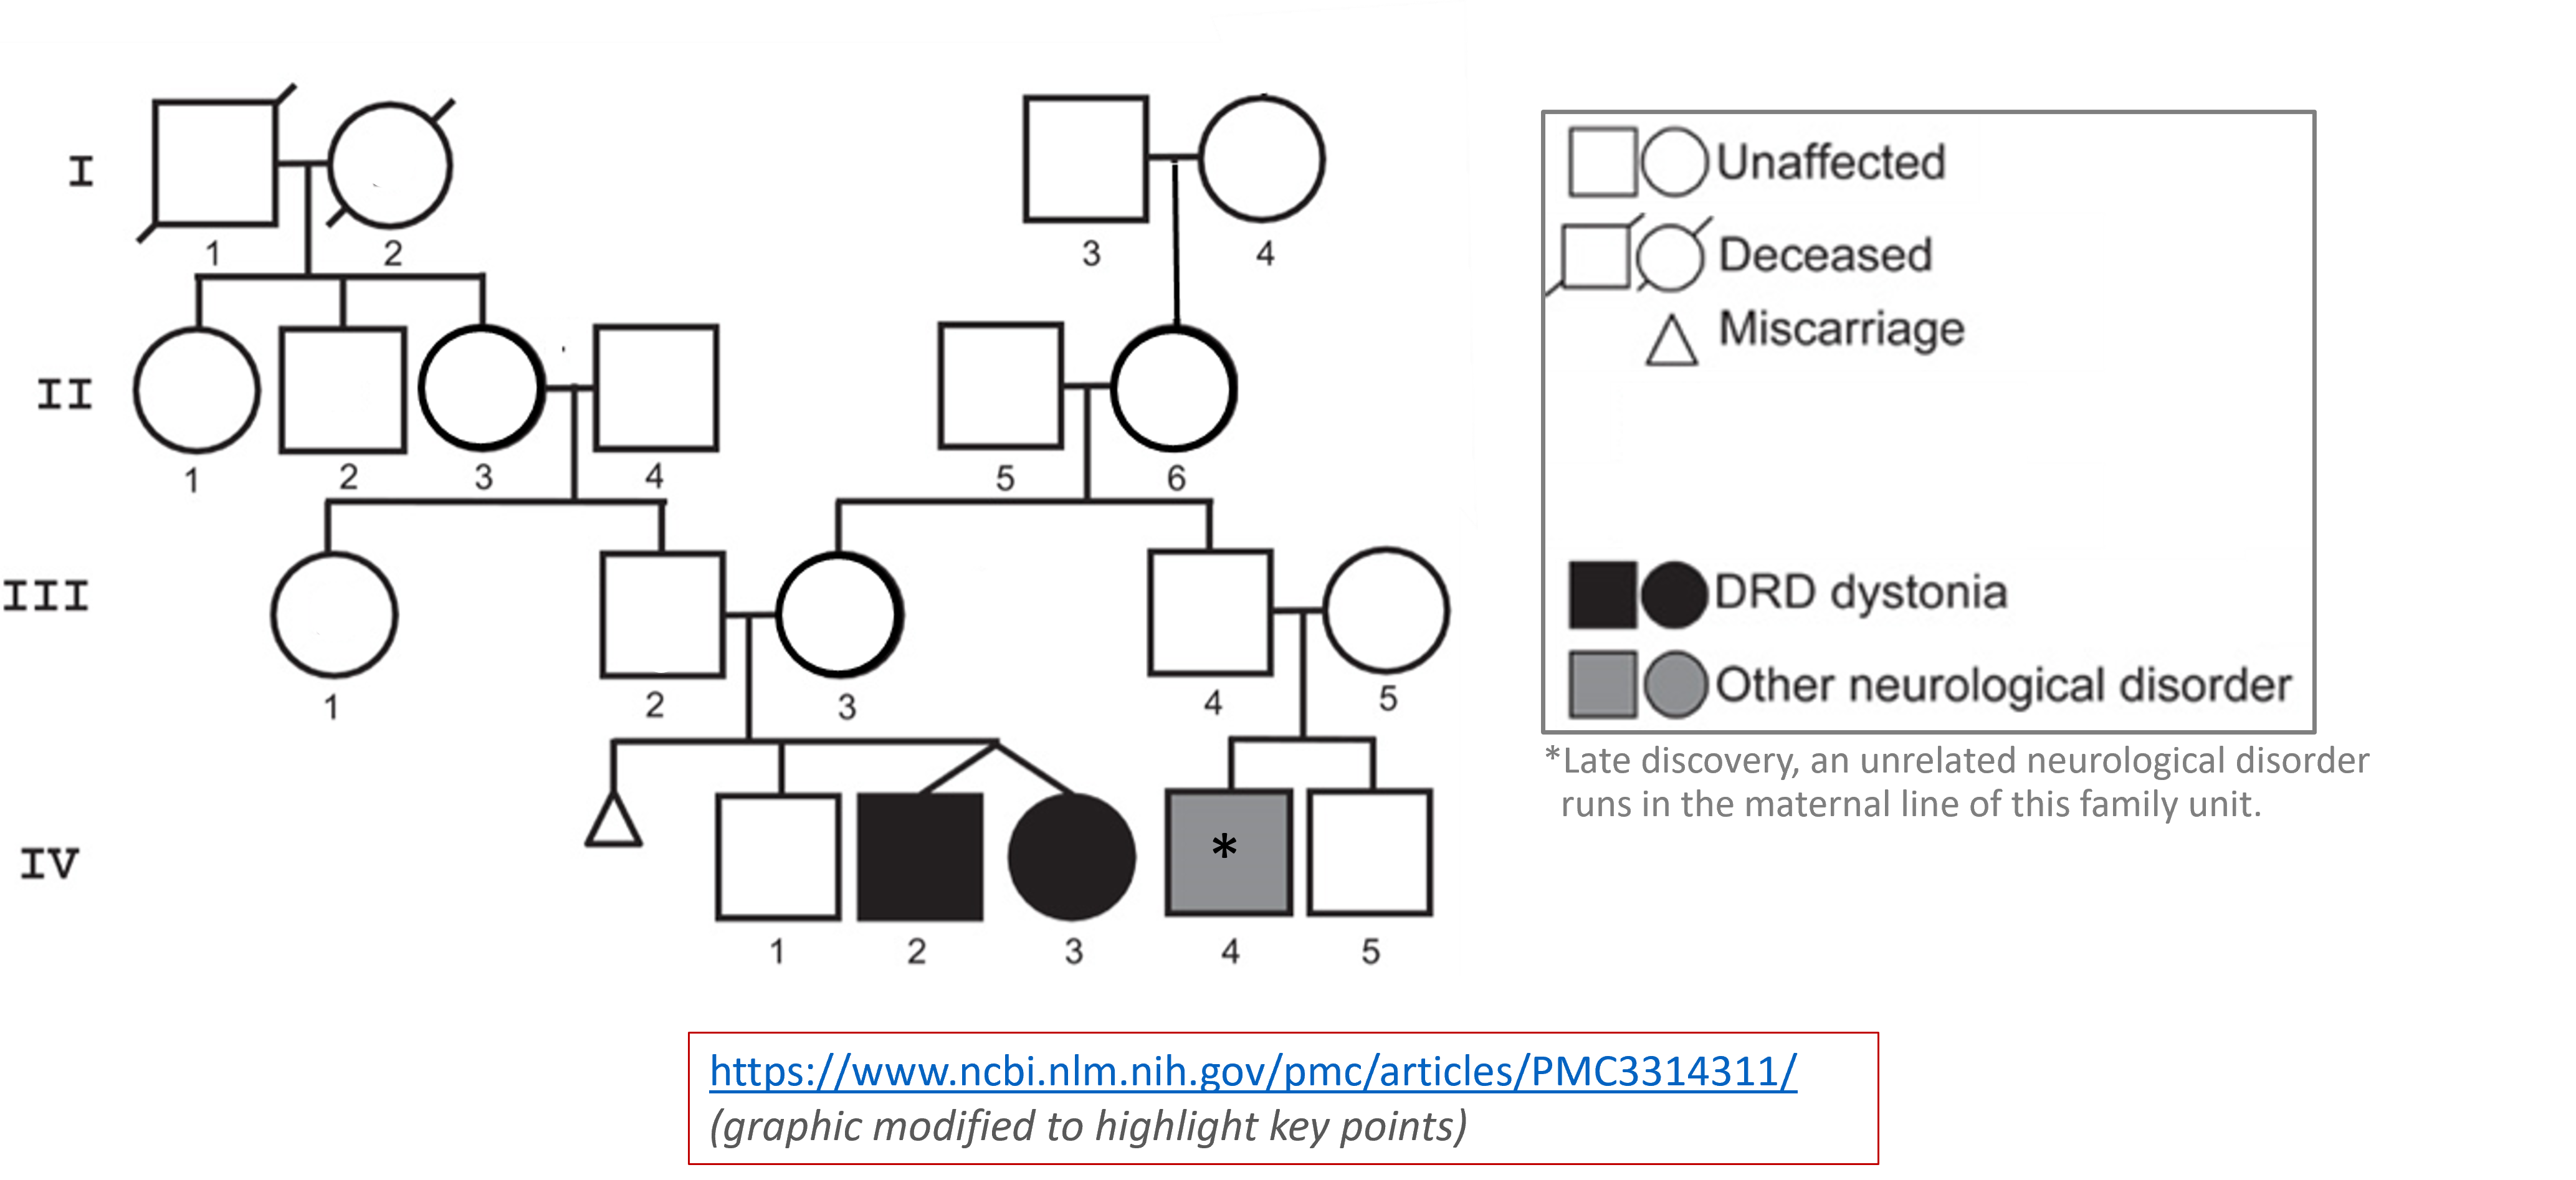
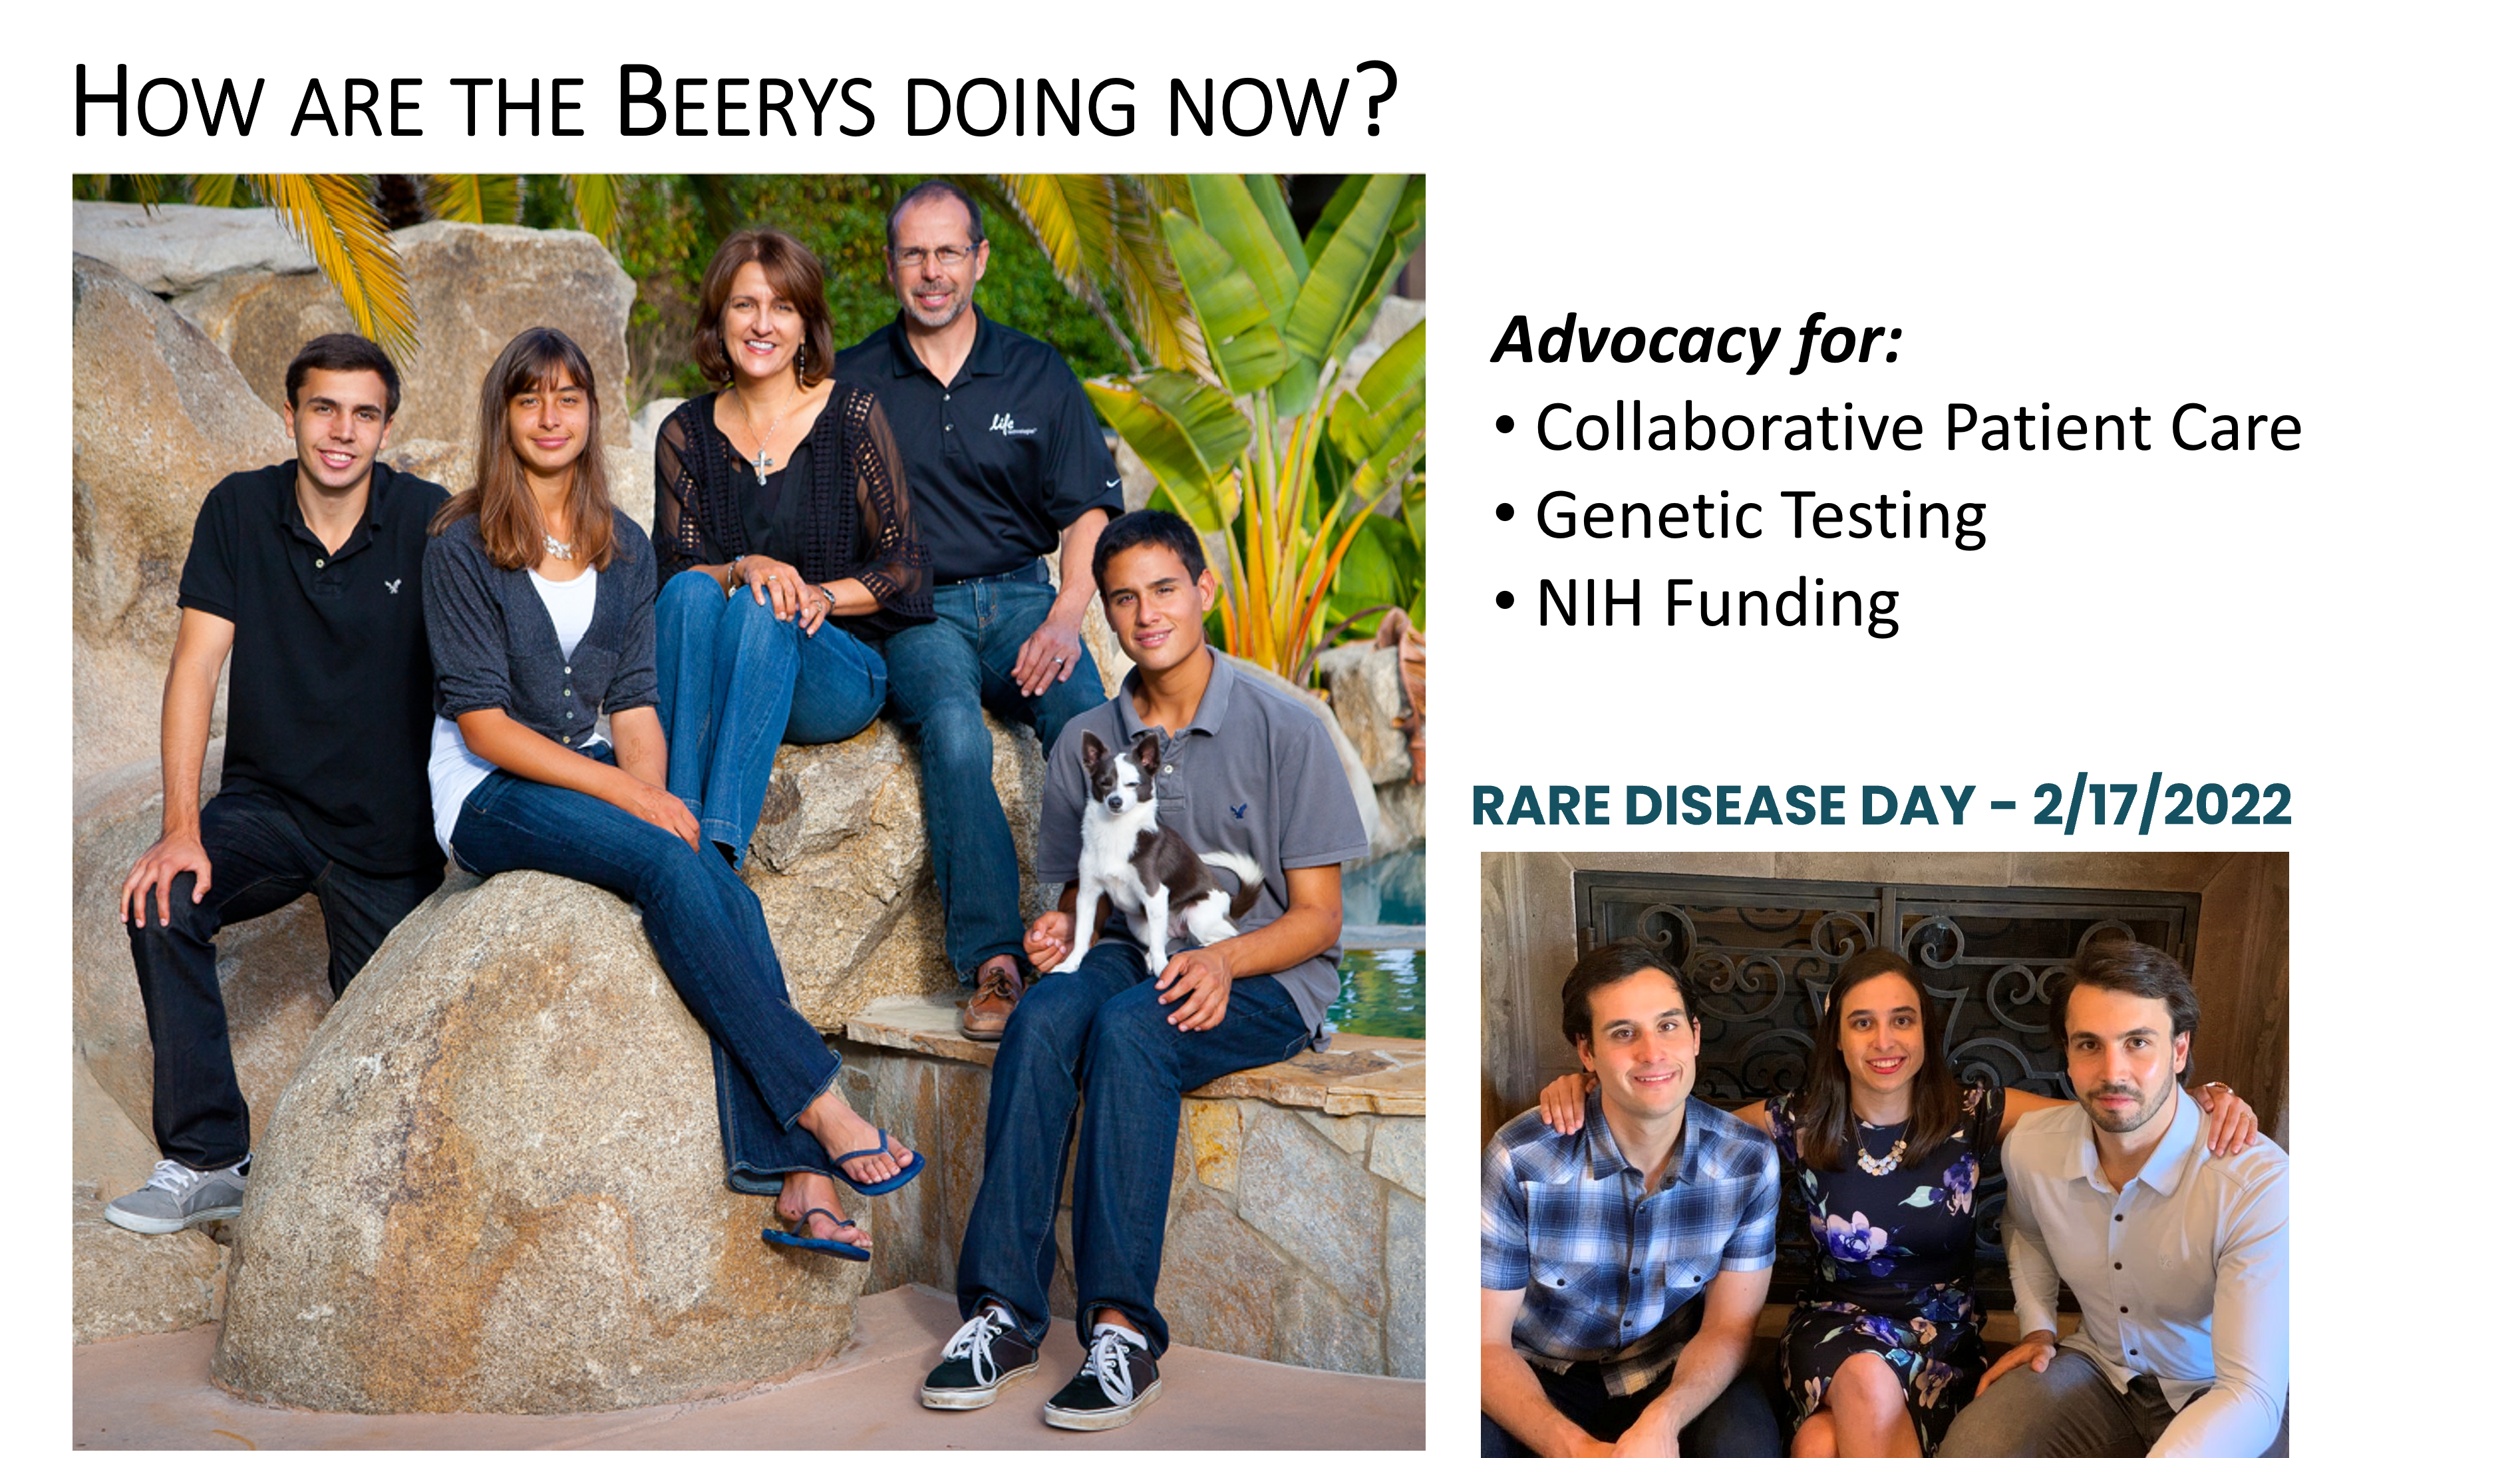
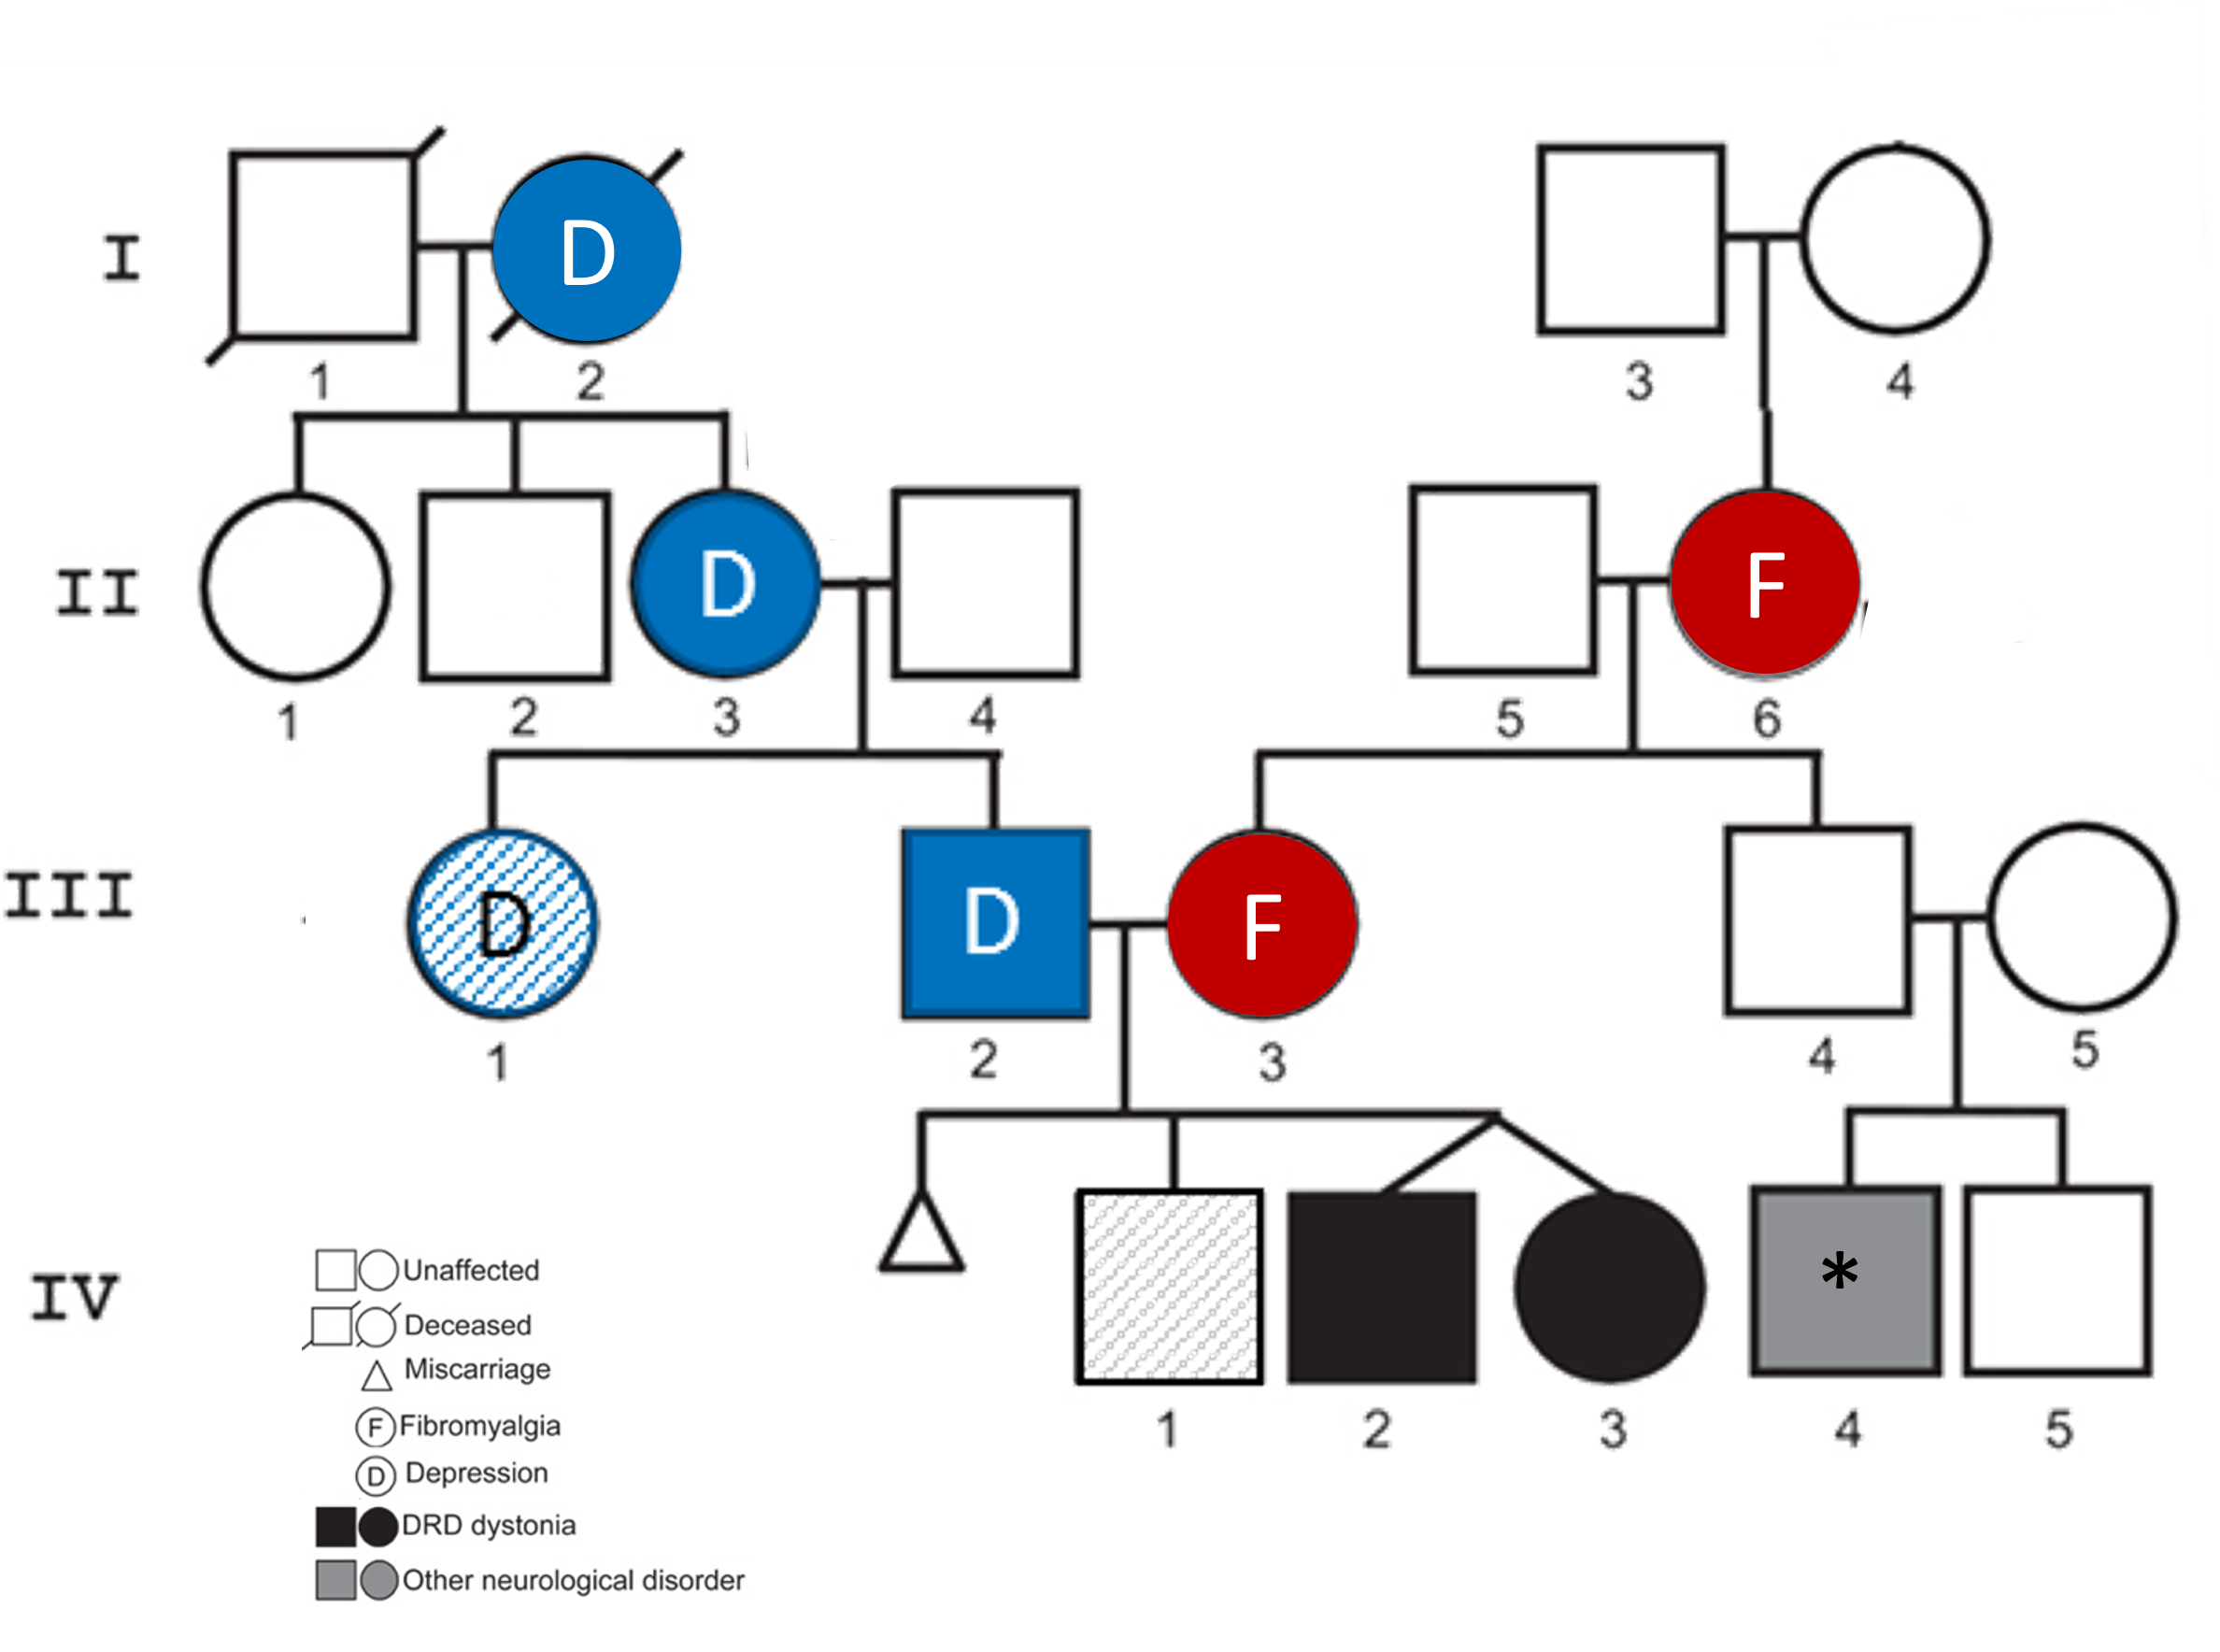
 You discuss the possible diagnosis with the twins' parents. They are particularly interested in genetics now, as the twins' father is now the CIO of a biotechnology company working with a world renown genomics facility. They are also very curious about how anything they might find would relate to family members, since there do not appear to be relevant disorders in others.....but there are other known issues, such as depression and fibromyalgia - which rumors have suggested might have genetic bases. You discuss the possible diagnosis with the twins' parents. They are particularly interested in genetics now, as the twins' father is now the CIO of a biotechnology company working with a world renown genomics facility. They are also very curious about how anything they might find would relate to family members, since there do not appear to be relevant disorders in others.....but there are other known issues, such as depression and fibromyalgia - which rumors have suggested might have genetic bases.You decide to move forward with ordering genetic testing and send an order to the Genetic Testing Laboratory. |
What does the patient's genetic test report say?
The twins made a trip to the genetic testing laboratory and provided samples which were analyzed and the results have been sent to you for consultation.Let's map this result onto that diagram of some relevant metabolic pathways....
Take a look here at some information that I've pulled it together from an old molecular biology textbook available on the NCBI Bookshelf!
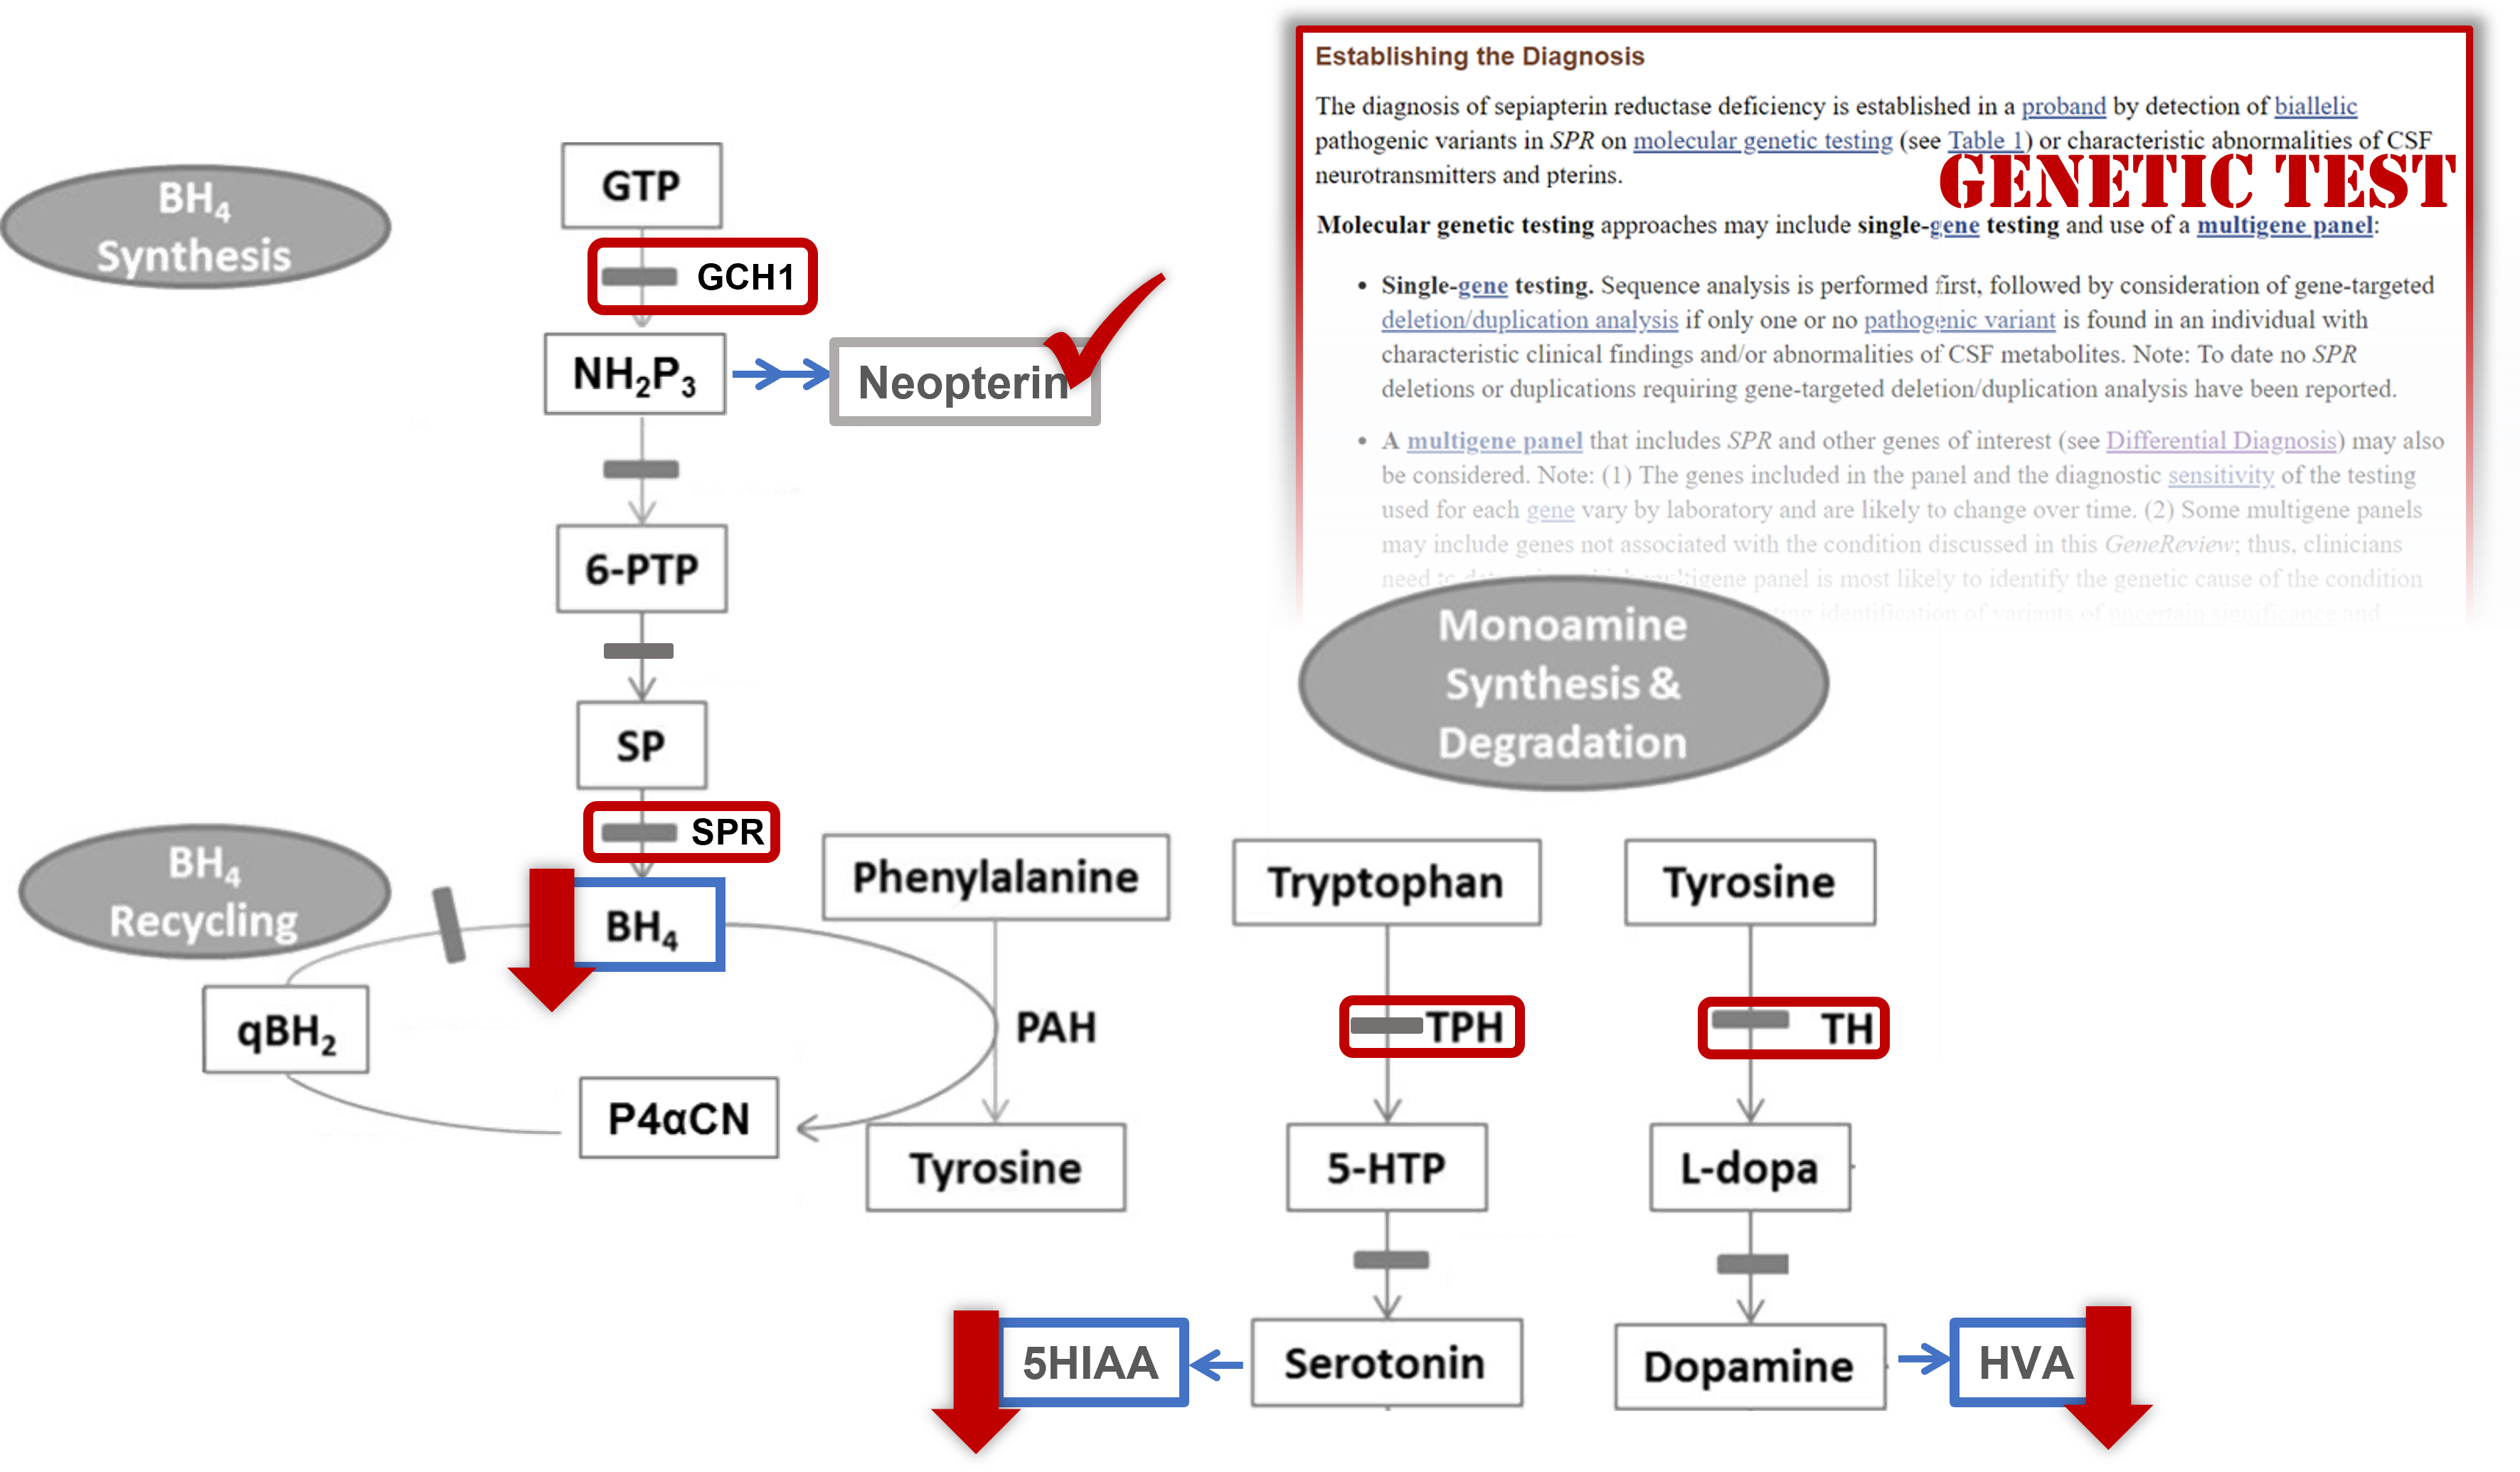
Note: A great central resource to find genetic tests for a condition-of-interest, is the NIH Genetic Testing Registry. You can search it directly from the resource's homepage or you can link to relevant genetic tests directly from a link on the right-hand side of a MedGen disorder page.
What is currently known about the identified variant?
Genetic testing laboratories attempt to stay up to date with what is known about the genetic variants that they are assessing. However, it is sometimes valuable to quickly consult with national database of clinical variants (NCBI's ClinVar database) to learn what other organizations have asserted/interpreted for that variant, if anything. In addition to information from testing laboratories, ClinVar receives curated interpretations from authoritative sources such as ClinGen, ACMG and disorder-specific specialist panels. If you need it, you can click here to get to a direct link for the ClinVar record page.
Look over the ClinVar records to see information submitted to NCBI's ClinVar from clinical laboratories, expert panels and clinical genetics organizations.
In the Patient Case Review guide sheet: Notate the asserted interpretation classifications as listed in ClinVar.
Look in the Variant Details tab to find biology-related information about this variant.
| Genetic Variant | HGVS for the position in the gene (NG_ g.____) | HGVS for the position in the protein (NP_ p._____) |
| SPR Arg150Gly | ||
| SPR Lys251Ter |
In the Patient Case Review guide sheet: Notate the HGVS terms you've found above.
NOTE! These variants are real! Here is the real data from a publication.

What is currently known about the identified gene?
If a particular gene has been implicated in a genetic test results indicating a pathogenic variant exists in a patient, it is often helpful to understand what that gene is, what its normal function is, where it is found (cellular and tissue expression patterns), and other sources of accessible information, such as links to relevant scientific literature.
NCBI's Gene database aggregates data from many NCBI databases as well as other high-quality resources to provide information and links to help users find and understand what is currently known about a particular organism's gene.
To learn more about the twins' impacted gene, search NCBI's Gene database with the gene symbol indicated on the genetic test result and find the record for the human version.
What is the normal function for the gene product? What else has been noted?
In the Patient Case Review guide sheet: Notate what you feel is important to know about the normal version of this gene product.
In which tissues is this gene normally expressed?
In the Patient Case Review guide sheet: Notate the tissues in which you would expect this gene to play a physiological role.
In the Gene Ontology Section of this record is a set of annotations for where this gene product is likely to be found within a cell (Component), what processes it is often involved in (Process), and what it does (Function).
Let's put this all of this together....
Does what you've found above make sense based on the patients' symptoms and personal history?
Map the variants through the bioinformatic flow!
Now that we understand which gene may be affected by the presence of the detected variant, mapping the variant through the central dogma of molecular biology can help indicate at which point it has its strongest impact.
 Click here to review an overview of the central dogma and genetic variation.
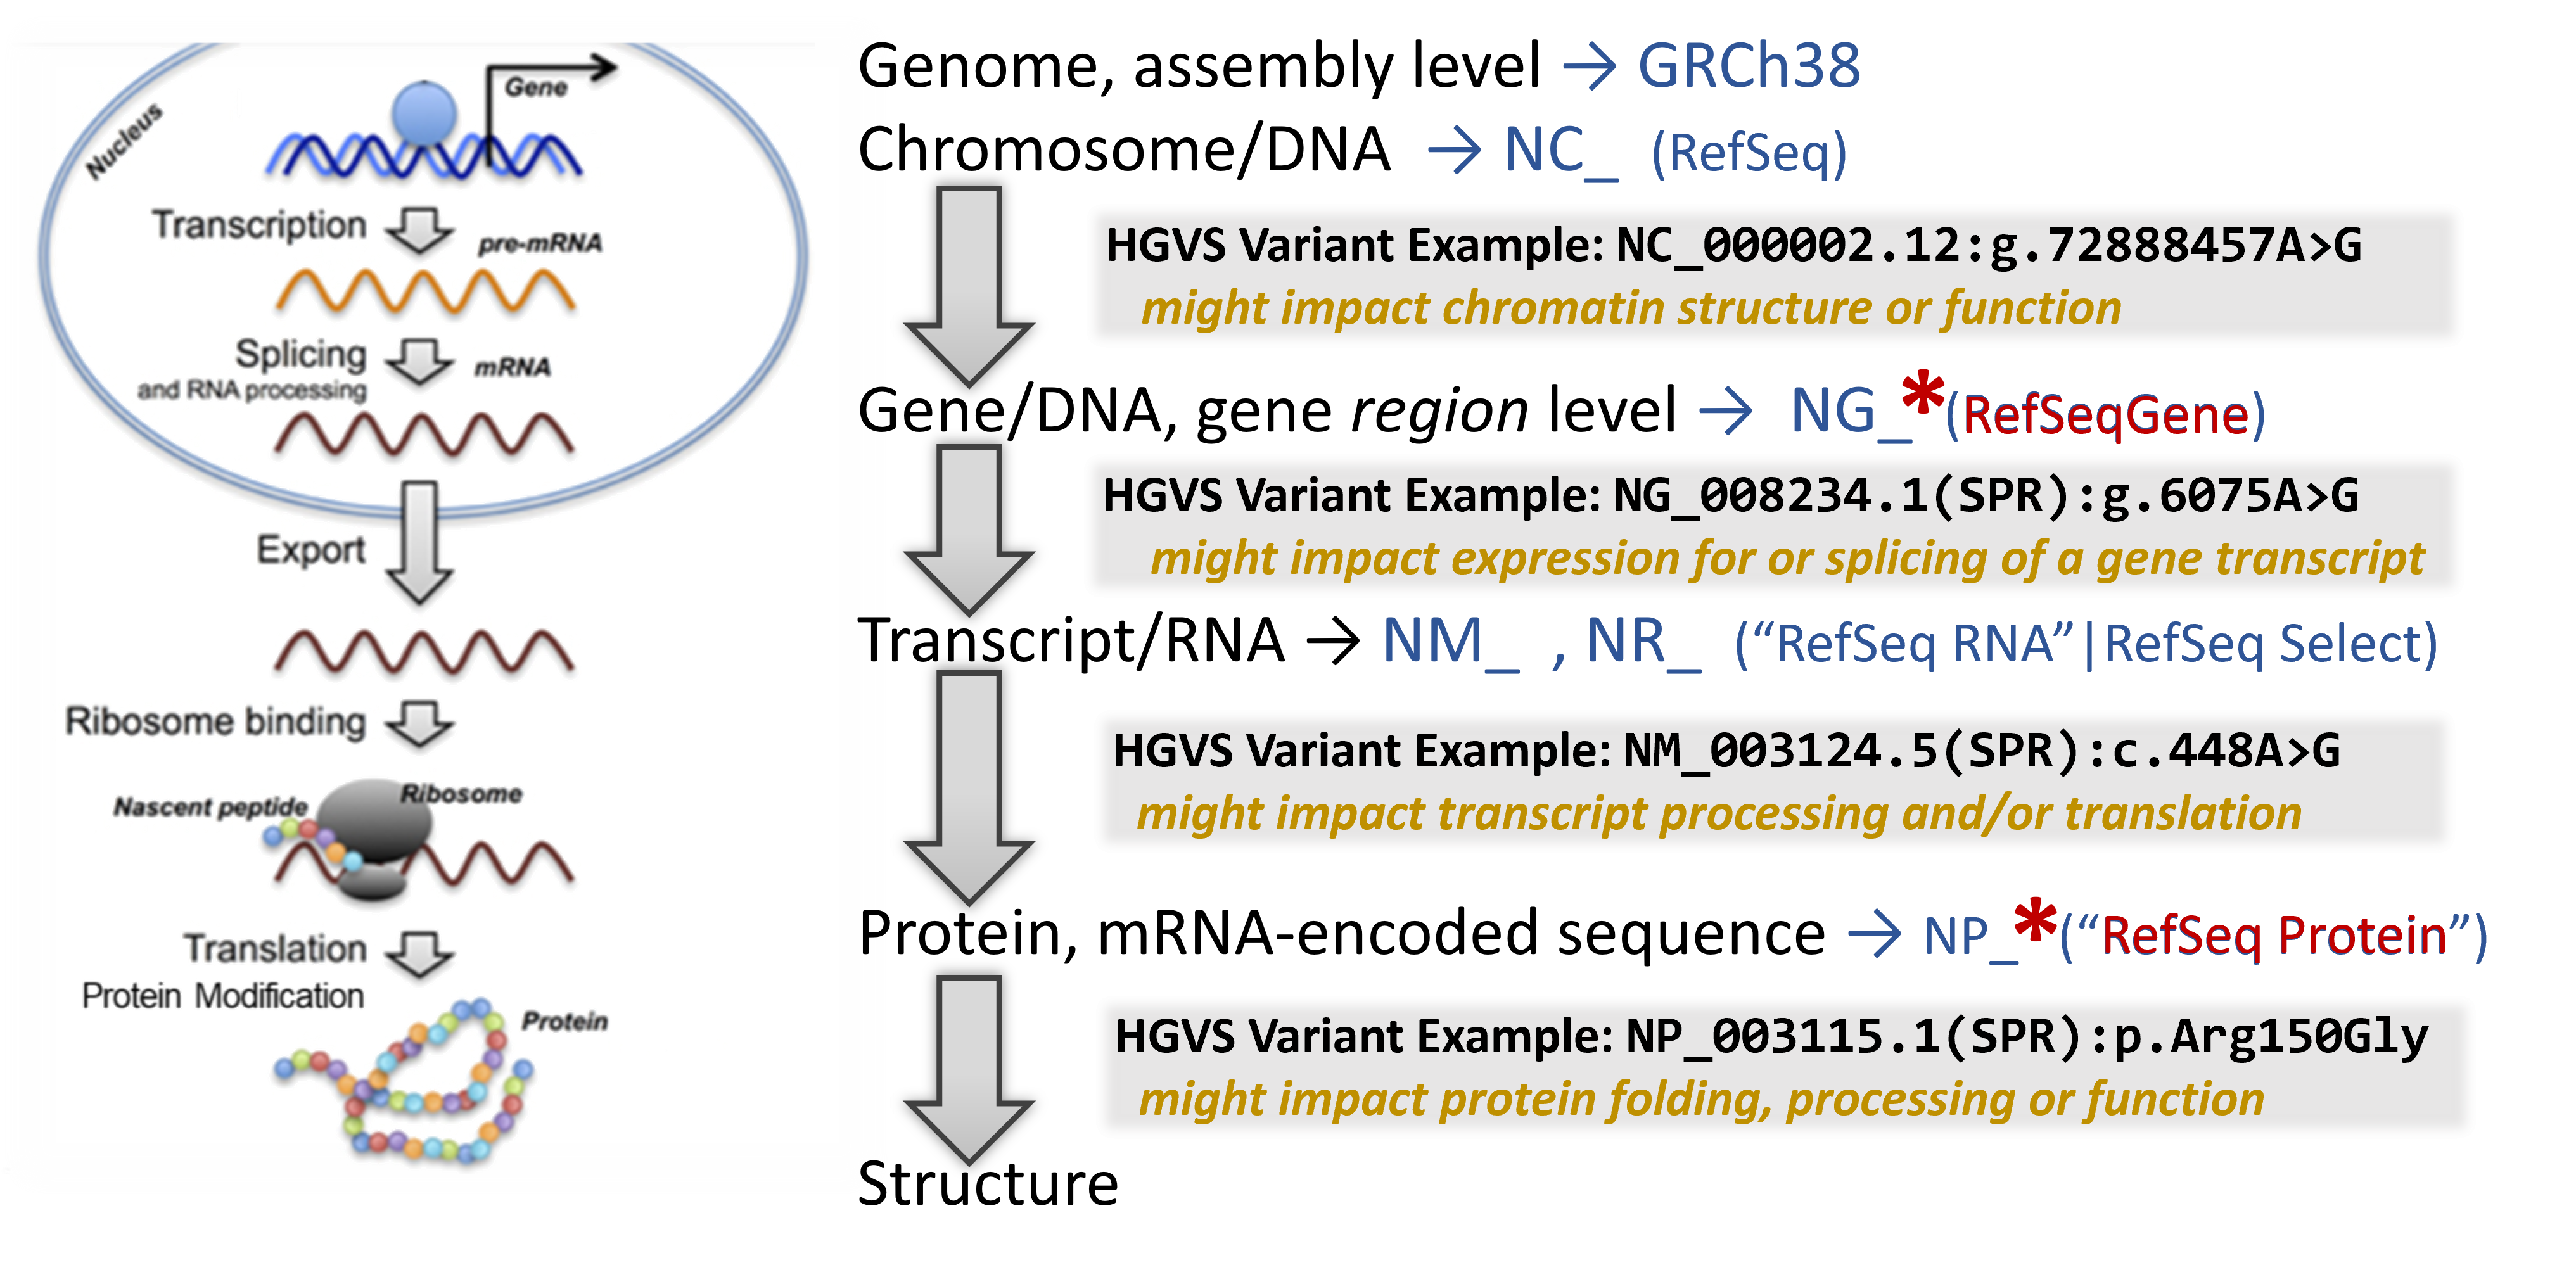
In addition to a lot of helpful aggregated information, NCBI's Gene database provides links to visualization tools which can help to identify where a variant is located in several critical biomolecules.
To learn about the molecular impact of the genetic variant, begin your search on the relevant NCBI Gene record. Then sequentially click on several helpful linked resources on this page to map the location and infer it's impact through this bioinformation flow
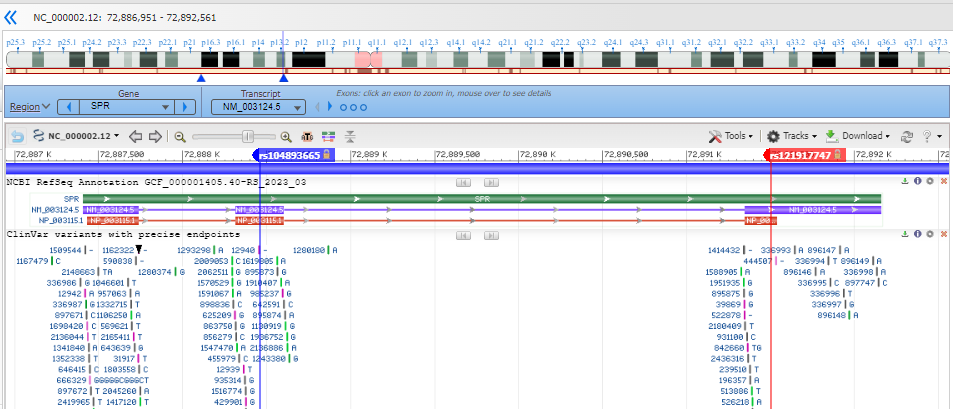
Note that you are looking at a portion of the chromosome (the accession shown is an NC_).
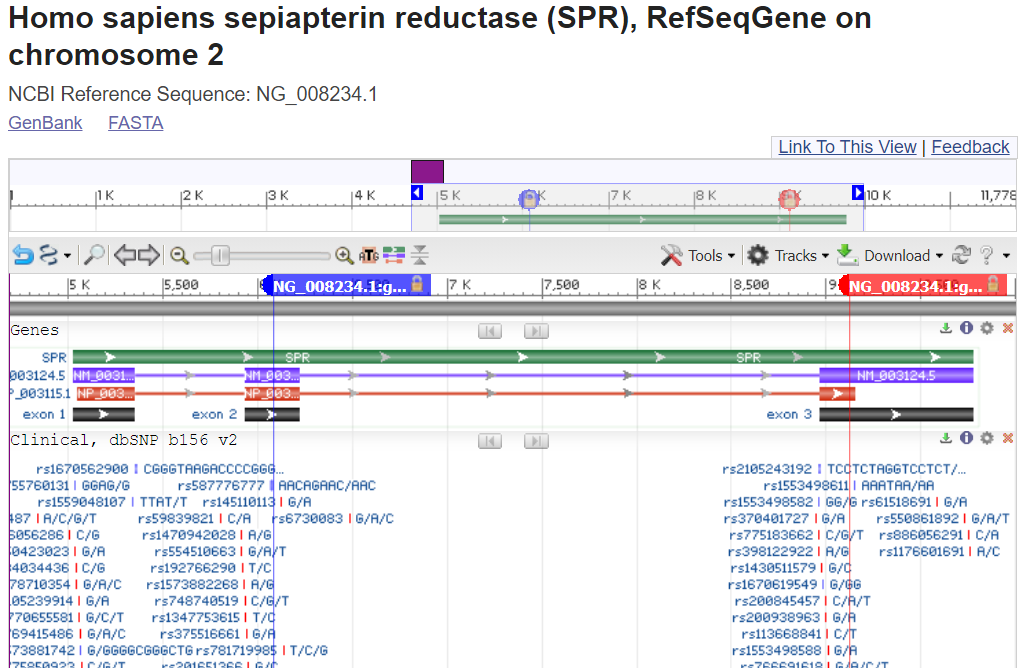
Zoom into the location of the variants by entering an HGVS term, such as: NG_008234.1:g.6075A>G OR NG_008234.1:g.9120A>T into the top-left text box to search for the variant location. (You can search with each sequentially to lay down each marker for further exploration.)
Where are the variants located in the gene structure? (in the upstream or downstream region surrounding the gene? in the 5'-untranslated portion of the transcript portion? near a splice site? in a coding exon?)
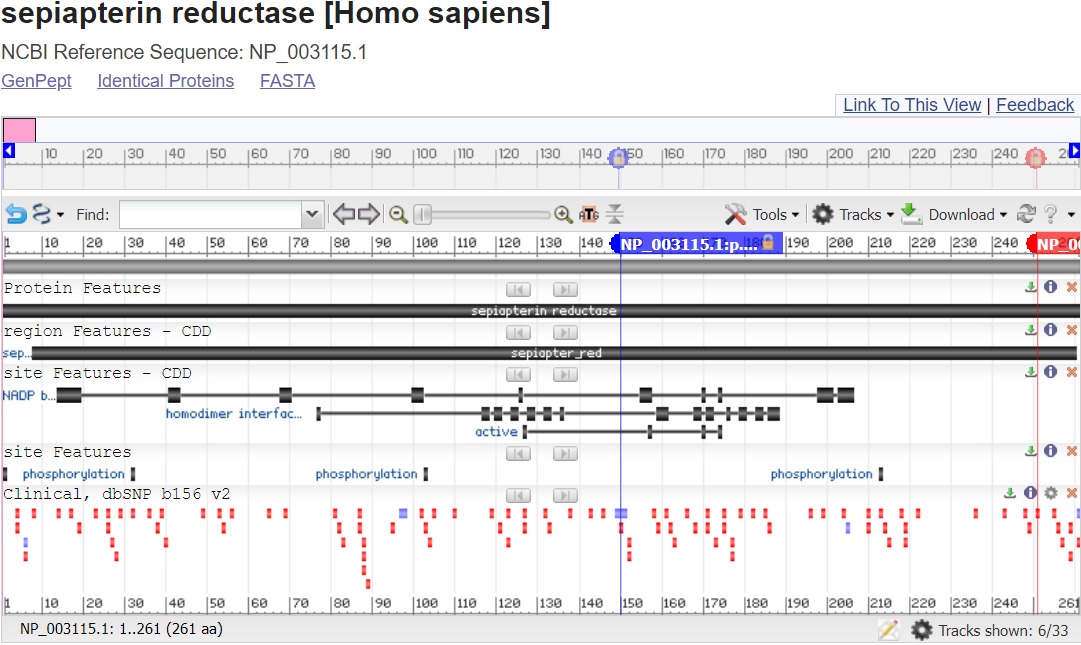
RefSeq Protein Graphic view shows the protein sequence, including conserved domains and other regions.
Note that you are looking at the full length of the protein sequence itself in this view. (the accession shown is an NP_).
To zoom into the location of the variants, you can click on the magnifying glass in the upper-left above the graphics display and enter HGVS terms such as: NP_003115.1:p.Arg150Gly OR NP_003115.1:p.Lys251Ter to place a marker for the each variant in the proper location.
In this RefSeq Protein Graphics view, you can mouse-over some lines, such as region & site reatures - CDD to read informational pop-ups about what you are seeing. You can even click on them to learn more about the functional regions.
For many gene products such as this one, you can even see the 3D Structure of the protein, sometimes substrates and ligands and sometimes full complexes and map the location of the genetic variant impact within it.
 Click here to see something pretty cool!
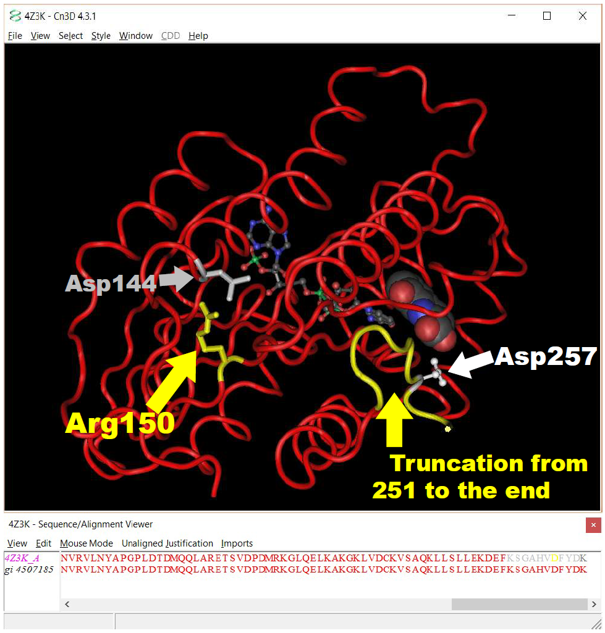 3D crystal structure monomer of the human SPR protein complex (PDB accession 4Z3K) as displayed in NCBI’s Cn3D Viewer.
The position of the two disease-causing variants are highlighted in yellow. With two additional residues displayed in grey and white. The two substrates for the SPR reaction are shown in ball-and-stick (NADPH) and in spacefill (Sepiapterin analog) rendering.
In human SPR, Arg150 forms a salt-bridge with Asp144 to stabilize the enzyme’s 3D structure – loss of this salt-bridge causes the protein to unfold and lose activity and be destroyed.
In human SPR, Arg251Ter truncation prevents the addition of Asp257, a critical binding residue for the enzyme’s substrate – loss of the enzyme’s ability to efficiently bind the substrate causes it to lose activity.
Let's put it all together to understand what is happening in the patients!
 The Twins' parents would like to have some answers.
Click here to review some things you may want to consider when formulating the answer to his questions.
-
-
-
-
- Which gene is impacted by the genetic variation and what does the gene product normally "do"?
- what is it's biomolecular function?
- what is it's impact on cellular physiology?
- in which cells/tissues is the gene product usually expressed?
- Based on the patient's variation(s):
- what do you think this would do to the gene product's structure and biomolecular function?
- what would this do to cellular physiology?
- what tissues or organs impact be impacted?
- Based on the proposed impacted-tissues/organs, may some of the the patient's symptoms be explained by this? (validating her experience)
- Which gene is impacted by the genetic variation and what does the gene product normally "do"?
-
-
-

What do you think is happening in your patients?
| Notes | |
| Diagnosis | |
| Genetic Variation(s) | |
| Proposed Molecular Mechanism of Variant Impact | |
| How does this relate to the phenotype? |
This was interesting, but is any of this clinically actionable?
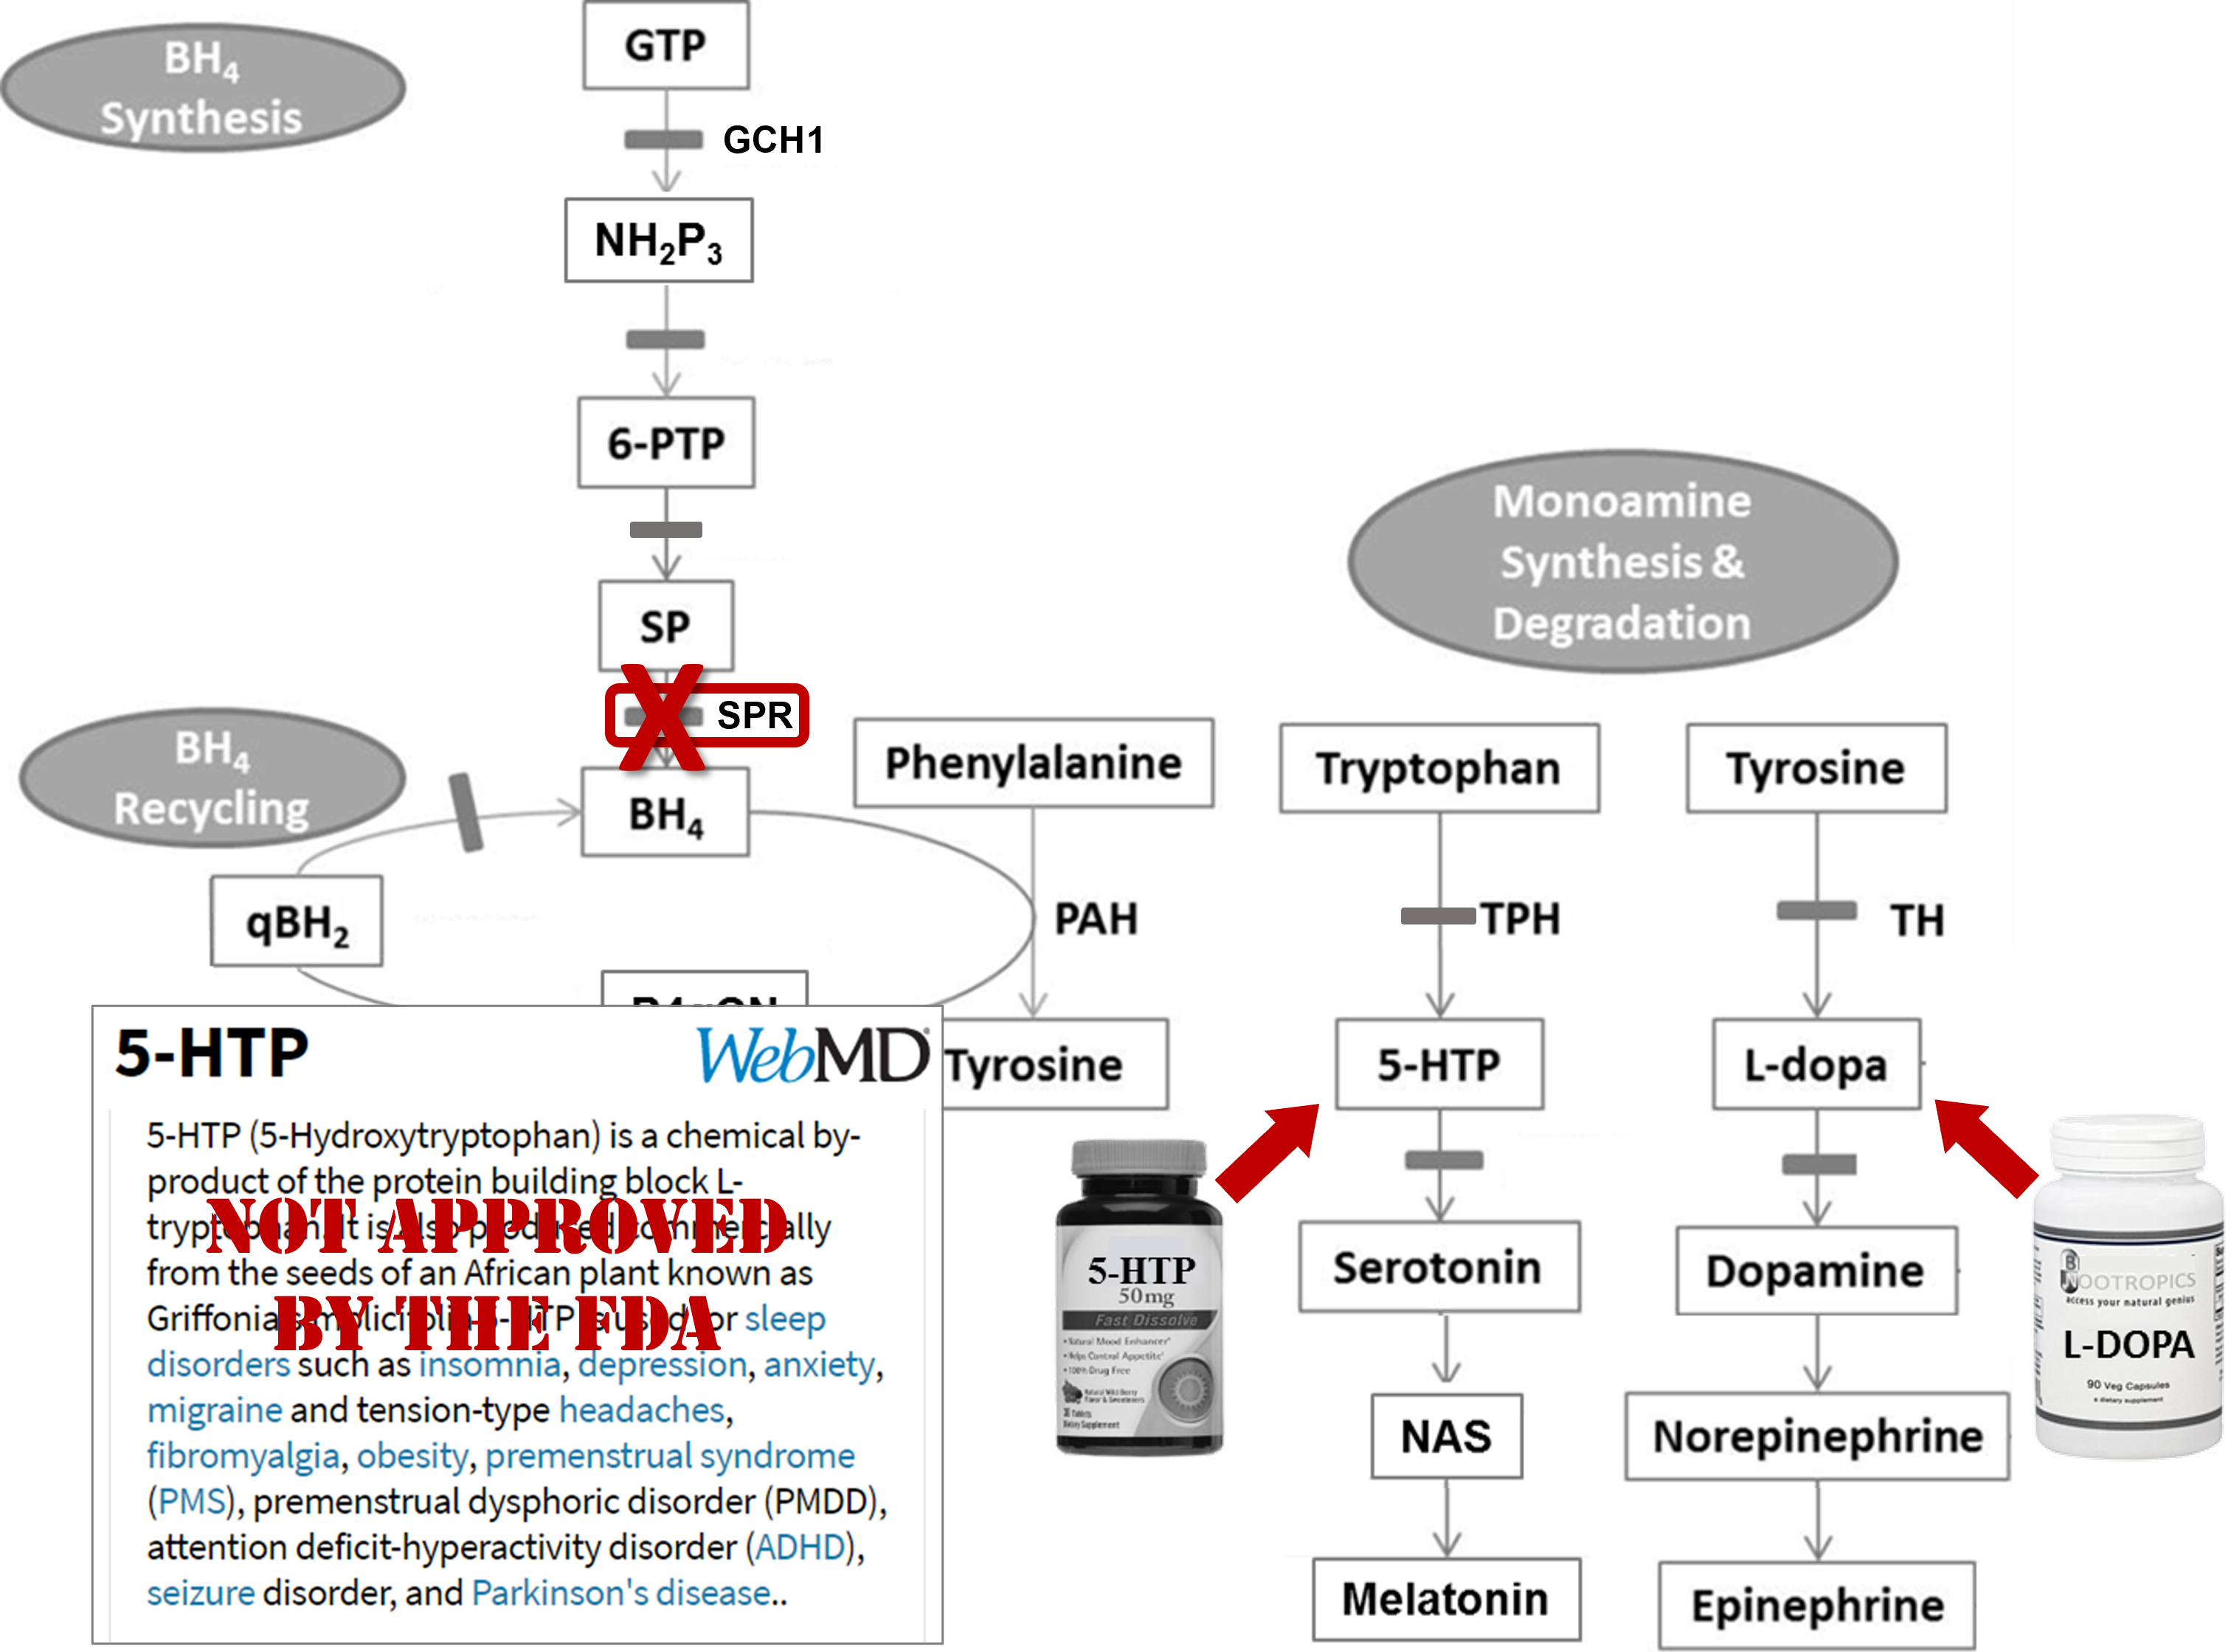
Take-away message!
Workflow: Together, we've gone in detail through this step-by-step process to learn more about the twins' genetic variants.Genetic disorder & molecular pathology: Genetic disorders are not always as simple and clear as Mendelian Genetics lectures might make them seem. In this case, the twins actually had inherited two different variants in the same gene. The only way we know which one was inherited from the mother and which from the father is due to the fact that they were willing to be tested as well. These inherited (somatic) mutations were later mapped through the two families and they correlate well with two other disorders....but that assertion is circumstantial and needs further study.
These two genetic variations mapped all the way down to the protein level and both, in different ways, disrupted the structure of the protein - one causing the inability to tightly hold a critical substrate and the other causing unfolding and eventual destruction of the protein. The two versions of the protein could have different levels of activity - destruction completely removing all activity, while substrate binding issues might cause a decrease in the activity. Regardless, if you look at the critical position of this gene/protein in the neurotransmitter cofactor pathway shown - either and particularly both can cause issues with the normal production of both serotonin as well as dopamine and downstream neuroactive compounds.
Why do the twins have slightly different levels of symptoms? We don't know for sure as there are many genetic and environmental factors that influence human biology. One possible reason? Well the two variations are on different chromsomes. (Again, we only know this because of the participation of the family in sequencing.) Pairs of genes on different chromosomes are not always expressed equally. If there are different sequences in the upstream promoter regions of genes, this can alter the levels of expression. We do not have information about those seqeunces in this case, but this is only one reason why there may be different amounts of proteins with different variations expressed.
ANSWER
Last Reviewed: August 22, 2023


