Example: Understanding a guardian of the genome
How we develop structural biology exercises with NCBI resources
- Who is the audience?
Students are introduced to structural biology at different stages in their educational career. Usually, I expect students to have a strong life science background (specializing in either chemistry, biology, genetics, etc.) with some understanding of higher order structures.
- What do they need to learn?
Students need to learn how structure can relate to function and what questions they’re able to ask and answer with 3D structures, iCn3D, and the connected scientific data.
- What is a relevant and interesting for the audience?
For structural examples, it is wise to choose a well-studied structure that has a clear role in biology- so a classic biological example. Ideally, this example should contain interesting interactions and different biomolecular components we can learn about. For example, binding ions, DNA, proteins, or a combination of all these.
- What kind of NCBI data & resources are relevant?
NCBI Structure, iCn3D, Structure Summary pages, VAST, ClinVar, PubMed, and more!
-
What workflow will help them understand the exercise?
Start by giving them fundamental information to be successful, including providing background information about their example, NCBI Structure, the 3D viewer (iCn3D) and what questions you can answer with these tools. Then, encourage them to explore the 3D viewer and structure within a scientific lense they are comfortable with. Lastly, render an informative image that communicates something scientifically relevant and write a figure caption.
- How can I find reliable information and make sure my example works for my course?
- Teach what you know. Draw from an example or research project relevant to your group and search for a structure on NCBI's Structure Database.
- Leverage other NCBI tools to delve deeper in to the structure's context. For example, you could:
- Perform protein sequence analysis through p-BLAST to explore homologous proteins and identify conserved regions.
- Conduct sequence comparisons to understand evolutionary relationships and functional implications.
- Find structural data from a PubMed publication.
- Use other structural resources. For example, Protein Data Bank's Molecule of the Month has several interesting structural examples to choose from.
-
How can I assess that my students understand the content?
Have them render an informative image, communicate what they learned, and look for evidence that they feel empowered to continue learning about their structure. For example, can they create an image that highlights key interactions, like the p53 and DNA binding site?

Walk-through the exercise/materials
- Finding your structure
- Think structure to function
- Explore your structure
- Review the connected data
- Finalize your exercise
Step 1: Finding your structure
Search NCBI’s Structure Database
If you have a classic example, input a descriptive title in the search bar like “Tumor Suppressor P53 Complexed with DNA”
NCBI Structure Advanced Search Tips:
To find a good structure for your exercise, use the following fields in NCBI Structure Database:
- Molecule: Enter relevant keywords and specify the organism.
- Macromolecule Type: Select "Protein," "Nucleic Acid," "Carbohydrate," or "Lipid."
- Functional Classification: Refine by protein function (e.g., enzyme, transporter).
- Literature Reference: Include PubMed IDs for specific publications.
Getting to a Structure from Other NCBI Resources
From P-BLAST: If a protein with a known structure is similar to your query sequence, the P-BLAST results will often include links to the corresponding structure files. Click on a result’s description to learn more. Look for the “Related Information” tab and there will be links to “Structure- 3D structure displays” that will take you directly to the structure in iCn3D.
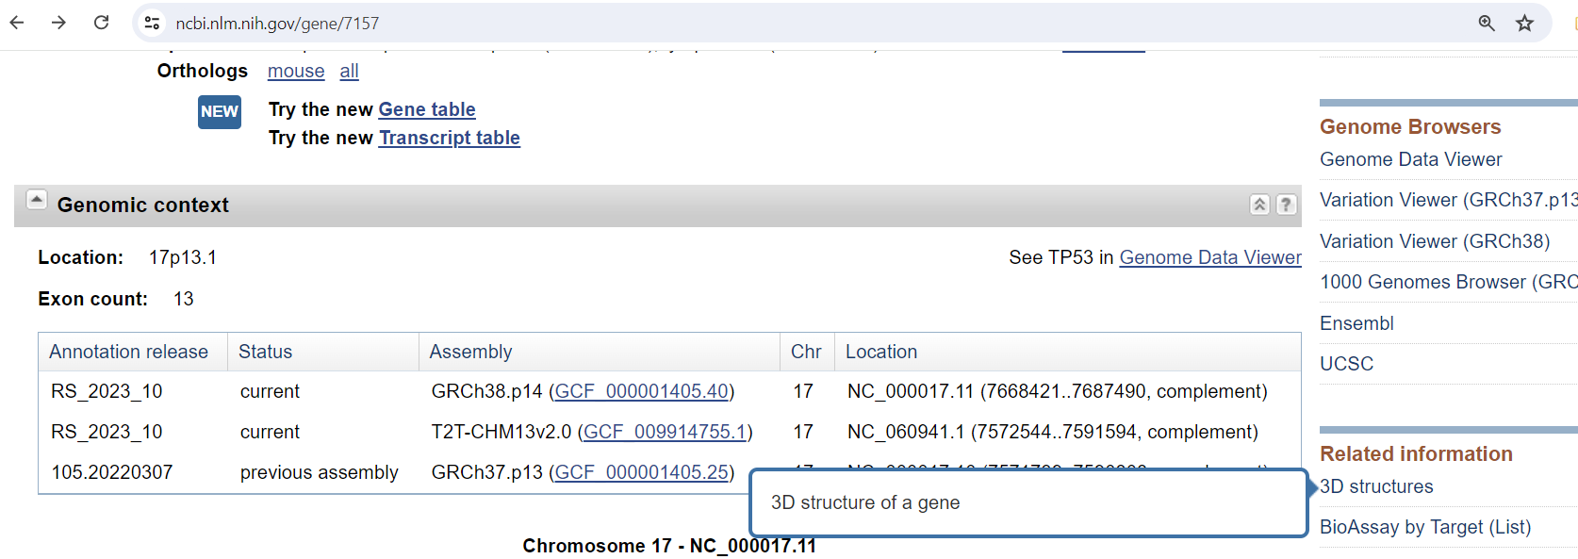
From Gene: On a gene record, look for “3D structures” on the right side. This will list structures associated with the gene, taking you to the NCBI Structure database. From there, you can use iCn3D to visualize the structure.

Step 2: Think structure to function
Review the information available on the structure summary page and ask what about this structure can we probe to understand how the biomolecule does its job. You can draw on several life science backgrounds- genomics, chemistry, molecular biology, evolutionary biology, etc.
What kind of questions can we ask?
What can the structure reveal about the biomolecule's actions? Consider how it binds to other molecules, folds into its unique shape, interacts with transcription factors, or carries out other essential tasks..
If we don’t know what to ask? How can we come up with questions?
If you're unsure where to start, leverage NCBI resources like the structure summary page itself or explore the biomolecule in iCn3D for fresh perspectives.
Step 3: Explore the structure
Explore your structure with iCn3D, get comfortable with the tool, and what you can learn with this tool. Experiment with the tool's features to gain a deep understanding of the molecule's three-dimensional architecture. Consider how different visualization options, like style and color, can provide insights into the biomolecule's function.
Step 4: Review the connected data
You can learn even more about your structure by exploring the Sequence and Annotations window. This feature connects to other NCBI databases and allows you to interactively view and interpret structural features of the biomolecule in the context of sequence information, review functional sites residues, explore the linked data sources, and more!
Some guidance on the type of information available:
- Conserved Domains: Highlight regions essential for protein function that haven't changed much over time.
- ClinVar: Show mutations linked to human diseases, helping interpret their potential impact.
- Functional Sites: Pinpoint crucial regions for protein activity, like binding pockets or enzyme active sites.
- Custom: Allows you to add your own data or annotations for personalized analysis, exploration, and hypothesis testing on your biomolecule's sequence and structure.
- 3D Domains: Reveal independent structural units within the protein, offering insights into folding and function.
- SNPs: Show single nucleotide polymorphisms, providing genetic variation data.
- PTM (UniProt): Highlight post-translational modifications like phosphorylation, affecting protein function.
- Disulfide Bonds: Identify covalent bonds between cysteine residues, stabilizing protein structure.
- Interactions: Map interactions between the protein and other molecules, like DNA or protein partners.
- Cross-Linkages: Visualize chemical connections between protein residues, providing structural restraints.
- Transmembrane: Identify regions spanning the cell membrane, essential for membrane proteins' function.
Step 5: Finalize your exercise
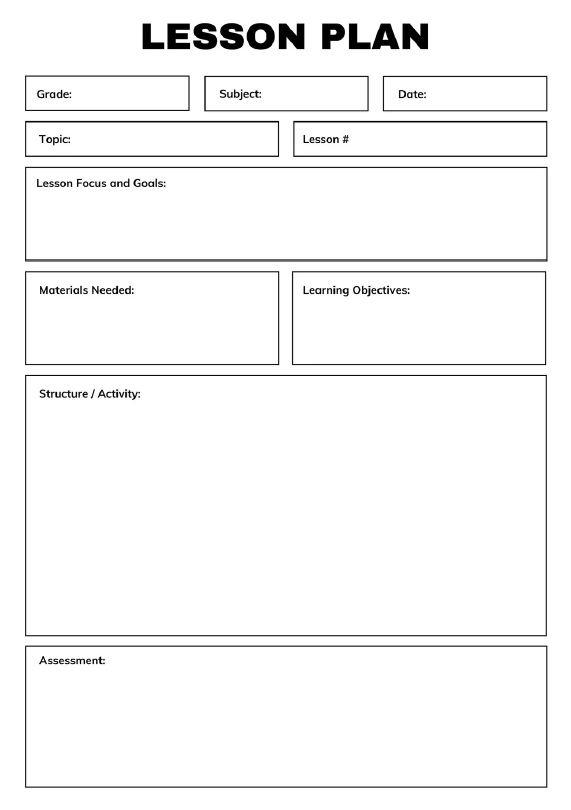
Conclude your exercise by determining how you want students to showcase their understanding. Create compelling visualizations to highlight key findings and inspire students to do the same. Focus on a few core concepts, such as the impact of mutations on protein interactions or the relationship between active sites and function.
Define Clear Learning Objectives
To guide your students' learning, craft clear and concise exercise objectives. These should outline the key skills and knowledge students will acquire. For example:
Example 1 - TP53 Mutation Analysis
The objective of this exercise is to investigate mutations in TP53 (PDB 1TUP) using iCn3D’s mutation analysis and the "ClinVar" feature in "Sequences & Annotations". Together, these analysis tools will help you better understand how disease-associated mutation within a functional domain might affect DNA binding. Follow Links are provided for guidance on time consuming steps.
Example 2 - TP53 from Structure to Function
The objective of this exercise is to explore active site residues and structural motifs to gain a better understanding of TP53 functional pathways. Participants can use a handful of features within iCn3D’s Sequences and Annotation window to visualize structure-function relationships and render an informative visualization. Follow Links are provided for guidance on time consuming steps.
BONUS: Review a related workshop!
Last Reviewed: June 24, 2024

