Telling Data-Driven Stories Using NCBI Analysis and Visualization Tools
Using clear and compelling visuals to communicated research results is a key part of the scientific process. NCBI has a number of tools for both interactive exploration of data and creation of custom images. In this workshop we will demonstrate how they can be used for visualization and analysis of DNA/protein sequences, whole genomes and macromolecular structures.
Structure of today's workshop:
- Overview of major NCBI visualization and analysis tools (this page, ~30 minutes):
- Breakout sessions with experts (~90+ minutes):
- Genome Exploration and Visualization
- Sequence Comparison and Visualization
- Biomolecular Structure Visualization
Comparative Genome Viewer
Overview
What is CGV? Comparative Genome Viewer (CGV) visualizes eukaryotic whole genome assembly-assembly alignments. You can choose from a selection of alignments that are provided by NCBI.
Why use CGV?
For example, you might want to see how a disease-associated region or gene has evolved in related species.
More specifically, use CGV to find:
-
- chromosome rearrangements, such as inversions
- large-scale insertions or deletions
- blocks of synteny, such as gene order conservation, between different species
- gene duplications or gene loss
- genomic changes in older and newer assemblies for the same species, or between different strains of the same species
What can CGV do?: Compare two eukaryotic assemblies
CGV includes animals, plants, and fungi-
-
- > 400 assemblies...and growing!
- ~200 species...and growing!
- ~480 alignments...and growing!
- Offers different assemblies for the same organism where available
- Request alignments
- Download a graphics file of the current view and download alignment files
- Caveats: Does not contain mitochondrial data, assemblies must already be in GenBank
-
Sample common workflow:
- Set up an alignment between human T2T-CHM13v2.0 and human GRCh38.p14.
- Use "Find a gene in this alignment" to search for glucose 6 phosphate isomerase.
- Click on the gene name under "Description" to see more details
Fill out the form on the home page to select an assembly pair with available whole genome alignment data. In steps 1 and 2, choose your species of interest, and then select assemblies in steps 3 and 4. You can start typing a species name or a common name and the form will automatically suggest available options.
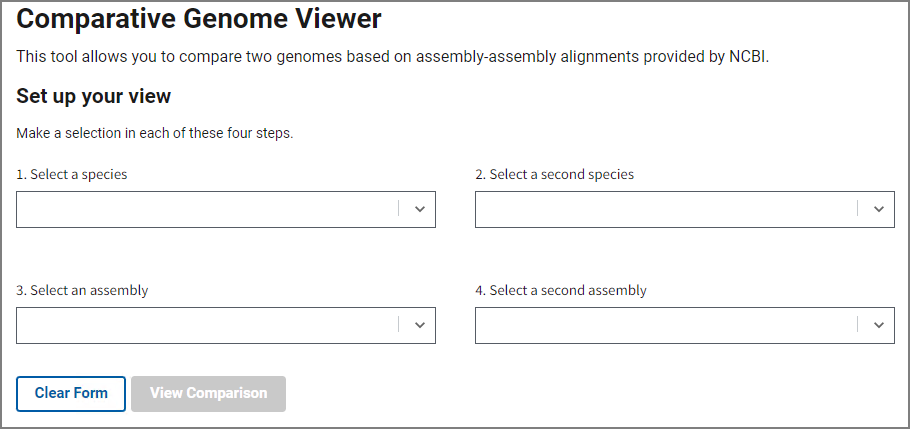
Once you’ve selected an assembly pair, press View Comparison to show the alignment in the graphical Comparative Genome Viewer. Contact us using the link at the bottom if you’d like request additional assembly comparisons.
Different assemblies for the same organism:
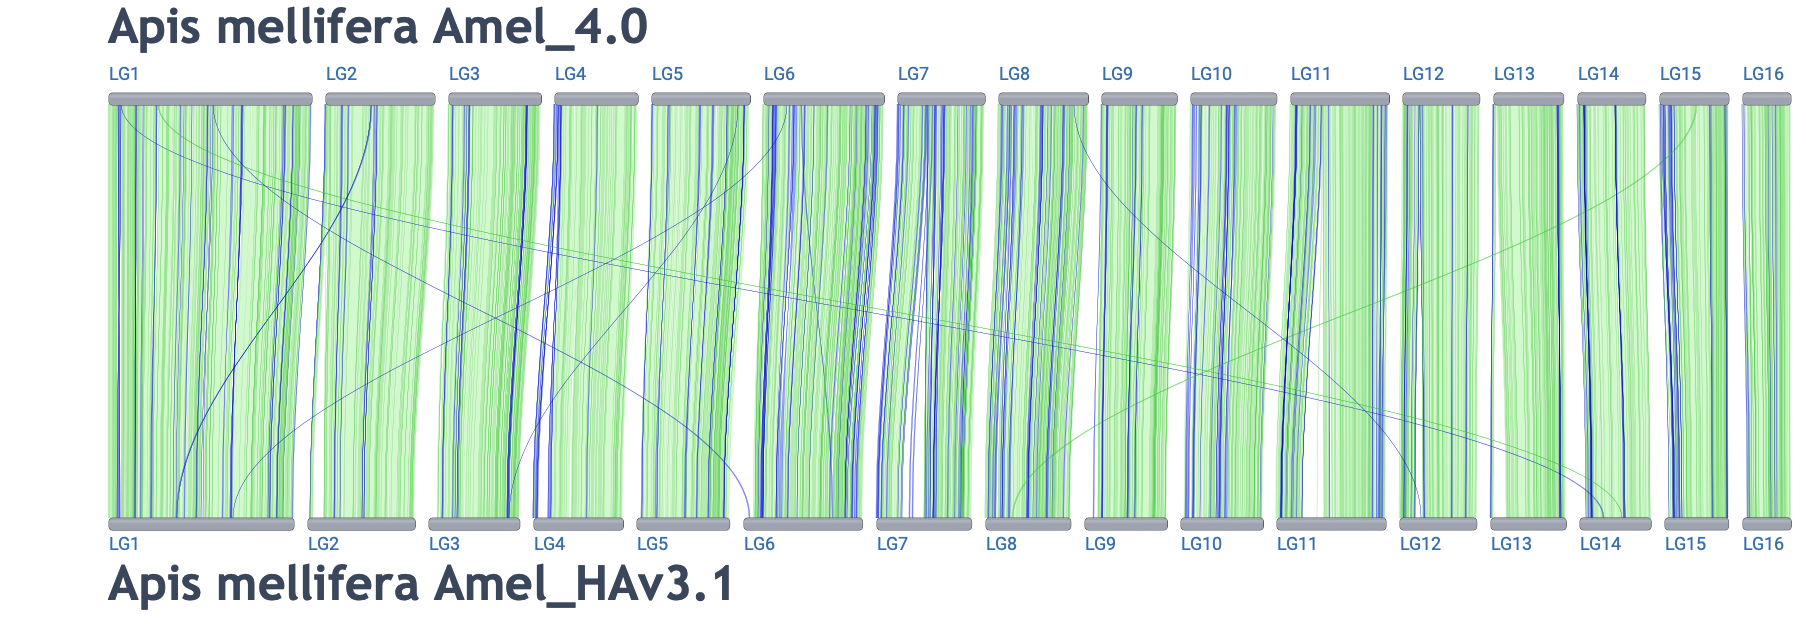
Link to alignment
Cross-species comparisons:
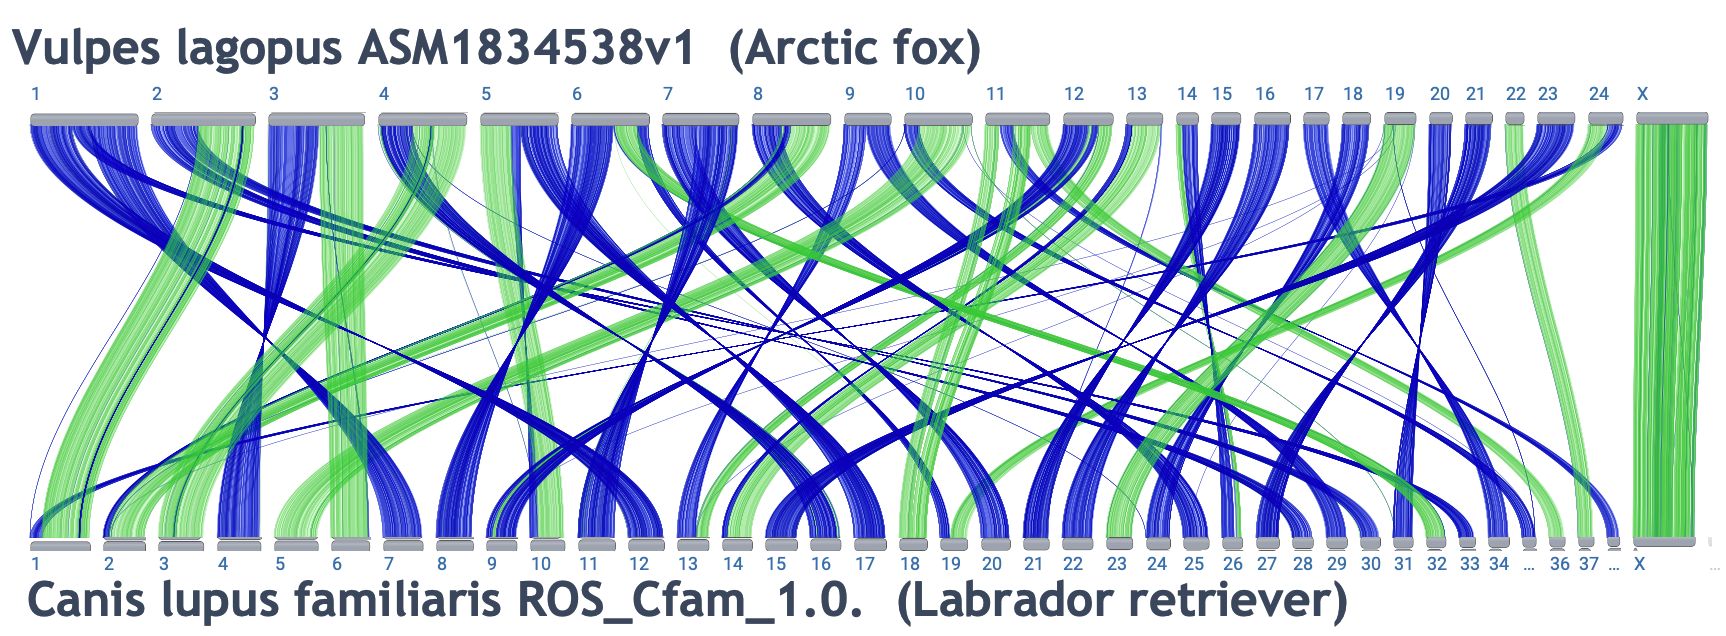
Link to alignment
View alignments as a dotplot:
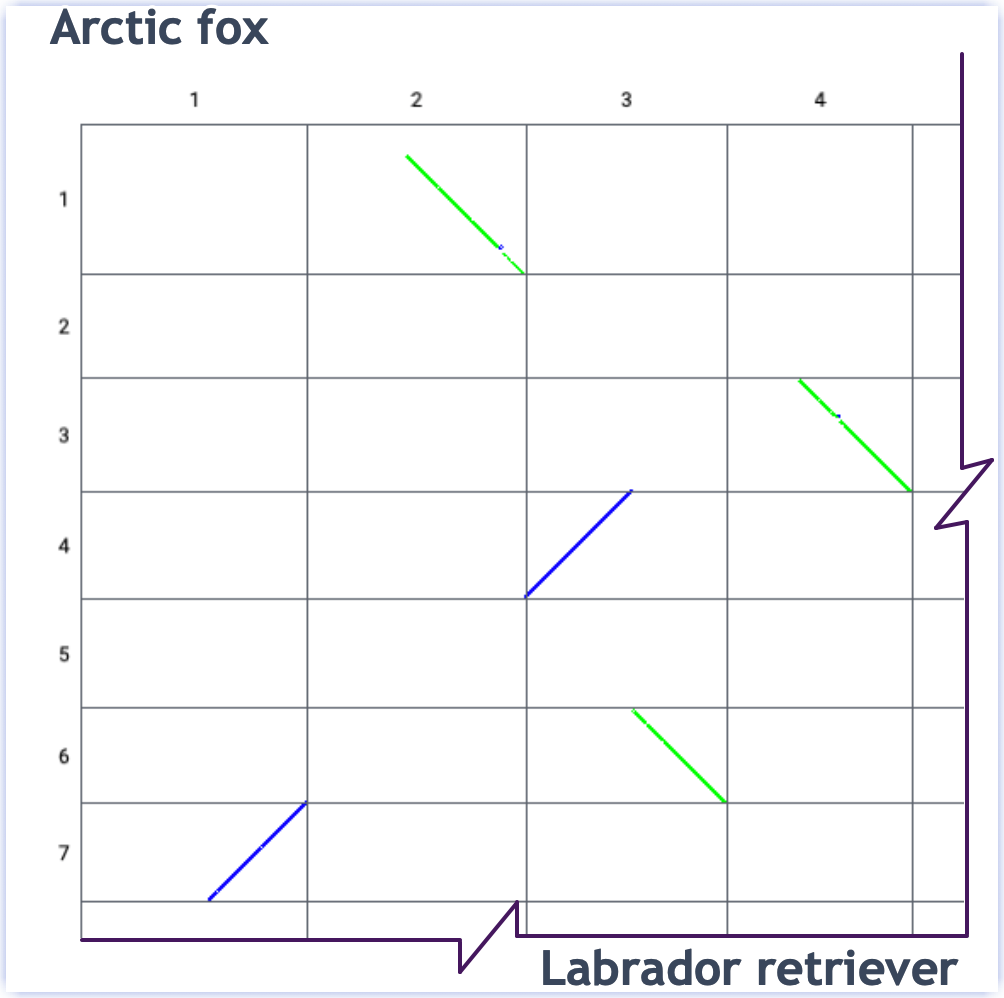
Link to view
View at different scales (i.e. gene level):
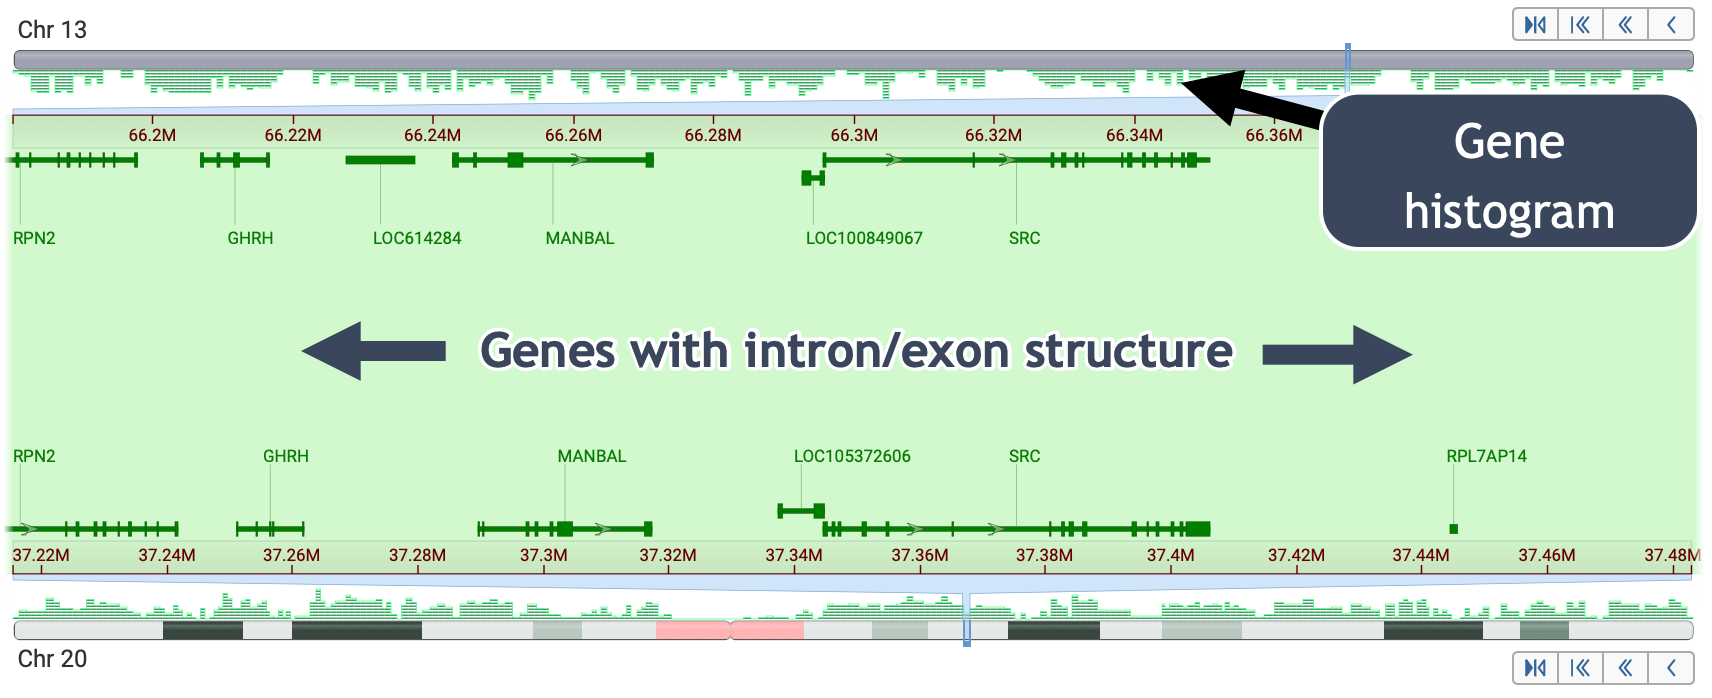
Four ways to access sequence-level data:
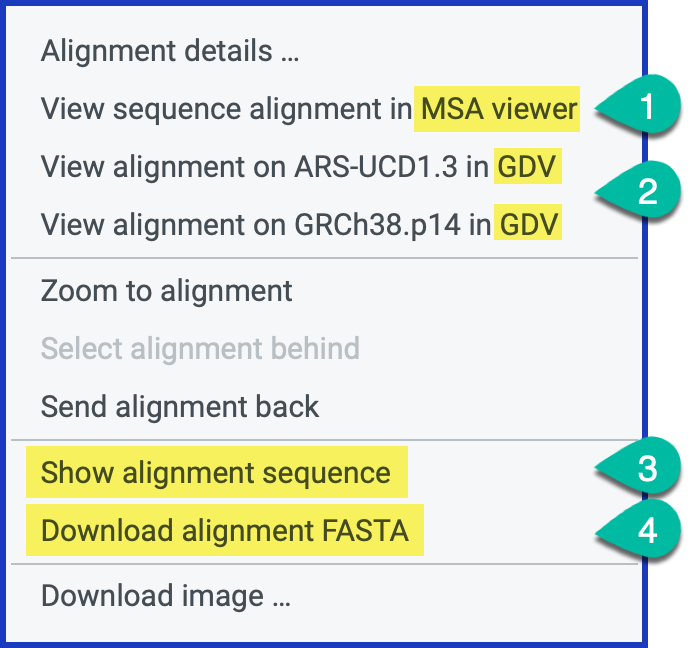
Resources:
- Help documentation
- For the meaning of "Best reciprocal match", see the link, assembly alignment documentation.
- Relevant CGV workshop
- Check out our YouTube tutorial for an overview of how to compare genomes using this tool.
Genome Data Viewer and Sequence Viewer
What is the Genome Data Viewer? GDV is a genome browser supporting the exploration and analysis of more than 3070 eukaryotic RefSeq genome assemblies. The GDV browser displays biological information mapped to a genome, including gene annotation, variation data, BLAST alignments, and experimental study data from the NCBI GEO and dbGaP databases.
In addition to being able to compare a genomic assembly with annotations from hundreds of different NCBI tracks, you can also upload data tracks produced by BLAST, import track hub data, or create tracks from your own data. This workshop focuses on eukaryotic genome data other than human, and is designed to help beginning or advanced users of GDV take advantage of the large amount of diverse genomic data available at NCBI.
Some reasons you might want to use Genome Data Viewer:
- Search a genomic assembly to display a region annotated with a particular gene, phenotype, genetic variant, and more
- View variation data from the EVA (European Variation Archive)
- Add other sources of variant data, including your own VCF files
- View non-RefSeq annotated genomes available in GDV
- Display BLAST results, for example, from a human query aligned to another organism
- Download a table of annotations for a region, including variants from the EVA
- Share your customized view with a colleague, and download a graphic for a presentation or manuscript.
Finding Organisms and Genome Assemblies
The GDV home page allows you find and select organisms and assemblies available to view in the browser. You can search directly for common or scientific names using the search box, or click on nodes in the tree to explore different taxa. Enter gene names, dbSNP ids, phenotypes, assembly components/scaffolds, or sequence accessions into the search box on the assembly information panel. Examples of searches relevant to the selected organism are shown below the box to assist you in constructing queries. You can provide location information as a range, point, or cytogenetic band. 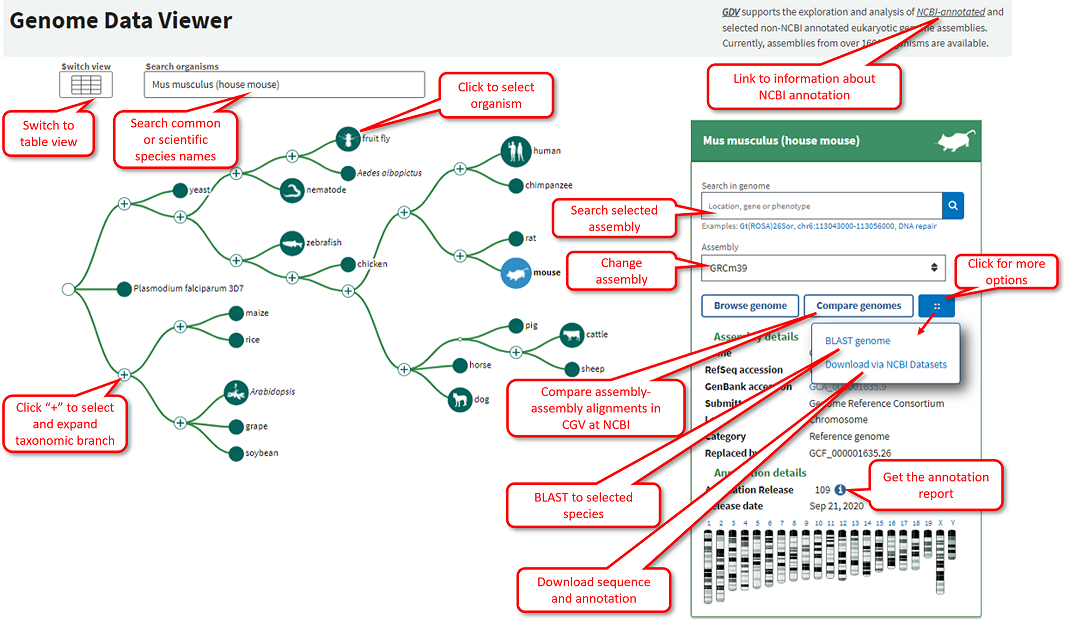
Below is an overview of GDV that highlights each of the main page elements The left sidebar contains a series of widgets that provide tools that can be used to manupulate the display. The center of the page contains an instance of the NCBI Sequence Viewer where tracks and track data is visualized. This GDV browser view can be customized in several ways. The caret arrow can be used to show or minimize each of the widgets on the left sidebar. These widgets can also be re-ordered by pressing within the header to select, and then dragging and dropping the widget into a desired location in the sidebar.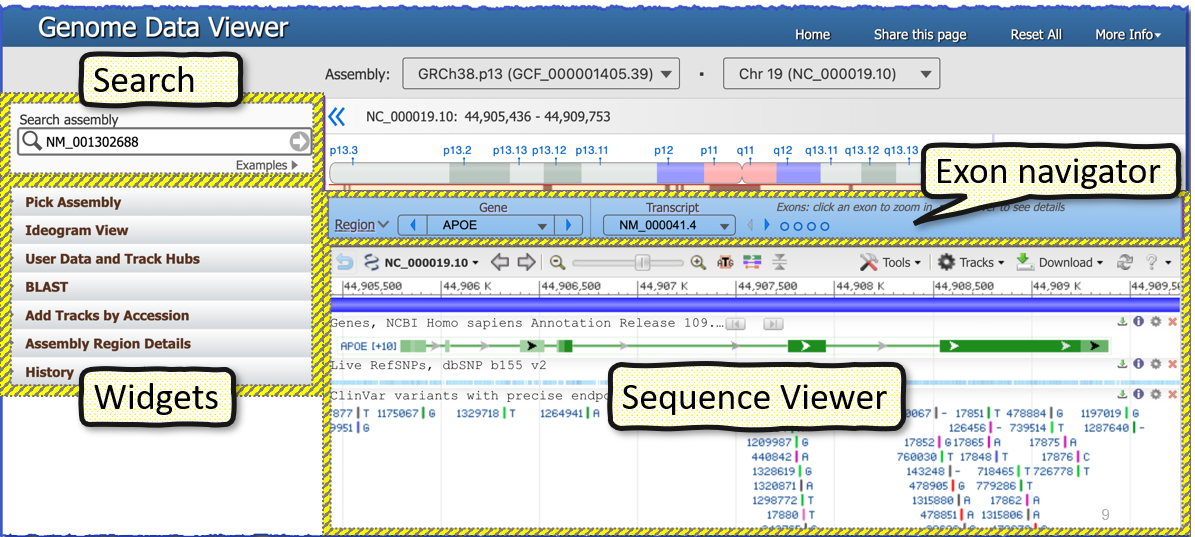
Tracks and User Data
One of the most powerful features of the Genome Data Viewer is the ability to load data to view on top of a genome assembly, such as:
- Stored results from a BLAST search
- NCBI-hosted tracks such as gene expression and sequence variation
- Data from the Short Read Archive (SRA)
- Data from Track Hubs, like GENCODE, and 8k+ others from the Track Hub Registry
- User data, such as your own gene expression library mapped to the reference genome
Sequence Viewer
NCBI Sequence Viewer is a graphical sequence display tool that is found on many NCBI pages, including NCBI Gene and Nucleotide record pages. It is also the core graphical component of the NCBI genome browsers, e.g. Genome Data Viewer. Sequence Viewer provides a linear graphical representation of features annotated or aligned to individual sequence accessions. You can use the pan arrows and zoom slider on the left side of the Sequence Viewer toolbar to navigate within this viewer; changes in the displayed range will be automatically propagated elsewhere in the genome browser, including to the Chromosome Region Selector and the Exon Navigator.
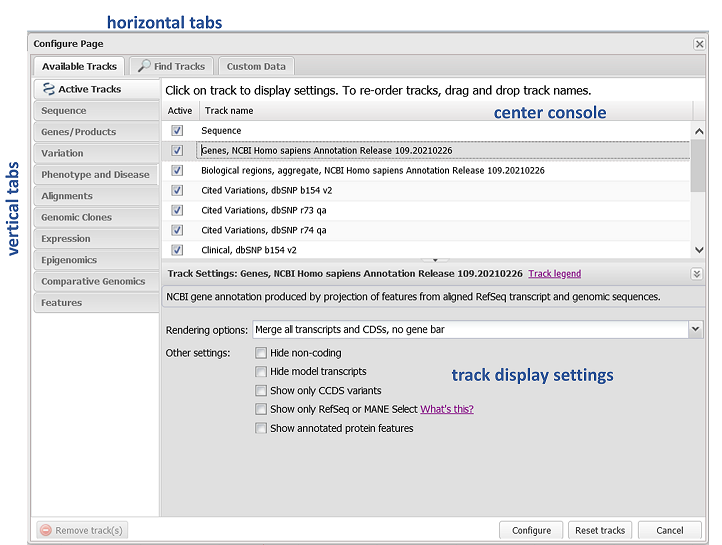
You can access NCBI Primer-BLAST, set markers, download sequence and track data, generate a PDF or SVG image, and more from within the Sequence Viewer toolbar and context menus. The Tracks button (in the upper right of the toolbar) allows you to configure the display with tracks provided by NCBI or to add custom tracks and BLAST request IDs. You can even embed the sequence data viewer into your own project!
BLAST and Related Viewers
NCBI’s BLAST is one of the most widely used bioinformatics tool in the world. It was designed to use a nucleotide or protein sequence to search and quickly find similar sequences in very large databases. While originally designed for studying evolutionary relationships, BLAST is now often used for identification of: the gene name and/or source organism of the sequence, related sequences from other organisms (homologs), as well as the location of a sequence within a larger reference sequence, such as a chromosome or genome.
What is BLAST?
- BLAST is an acronym for Basic Local Alignment Search Tool
- Pub: Altschul, S F et al. “Basic local alignment search tool.” Journal of molecular biology vol. 215,3 (1990): 403-10. PMID: 2231712
- A tool for searching databases of biological sequences, DNA or protein, using a sequence as a query
- Matches and aligns regions of biological sequences: DNA-DNA, Protein-Protein
- Programs:
- protein query, protein database
- blastp, psi-blast
- nucleotide query, nucleotide database
- megablast, blastn
- translating searches (useful for unannotated sequences)
- protein query, nucleotide database: tblastn
- nucleotide query, protein database: blastx
- nucleotide query, nucleotide database: tblastx
- protein query, protein database
- BLAST is the most widely used sequence similarity search tool in the world
- Web interfaces to databases at NCBI and many sites around the world
What does BLAST do?
- Finds high scoring local alignments between two sequences (protein or DNA)
- Includes a model of score distributions for random local alignments
- Provides statistical significance for matches / alignments
- BLAST returns non-chance similarities between biological sequences.
- If similarities are not due to chance, then they must be due to something else!
- Evolutionary relatedness (homology)
- Simple identification
- If similarities are not due to chance, then they must be due to something else!
How and why do people use BLAST?
-
-
Database searches
- To find homologs in other species, model organisms
- Homology is related to function
- A human protein that is a significant match to a yeast protein may have similar functions in both
- Homology is not a guarantee of the same function. Conversely proteins with similar functions may not be evolutionarily related.
- wings of birds, forelimb of mammals (homologs with related but not (exactly) the same function)
- wings of butterflies vs. wings of birds (not homologs but with similar function)
- Homology is related to function
- To identify a sequence — is this sequence already in the database and what is it?
- To identify or classify an organism from a sequence
- environmental samples, organism associated metagenomes
- specialized queries and databases: Targeted loci, barcode sequence (rRNA genes, cytochrome oxidase)
- To find homologs in other species, model organisms
-
Alignment tool
- To quickly align, match up positions in related sequences
-
Alignment plus database searches
- To annotate other sequences (find genes, identify exons)
- Aligning mRNA to genomic DNA
- Matching proteins to genomic translations
- To annotate other sequences (find genes, identify exons)
-
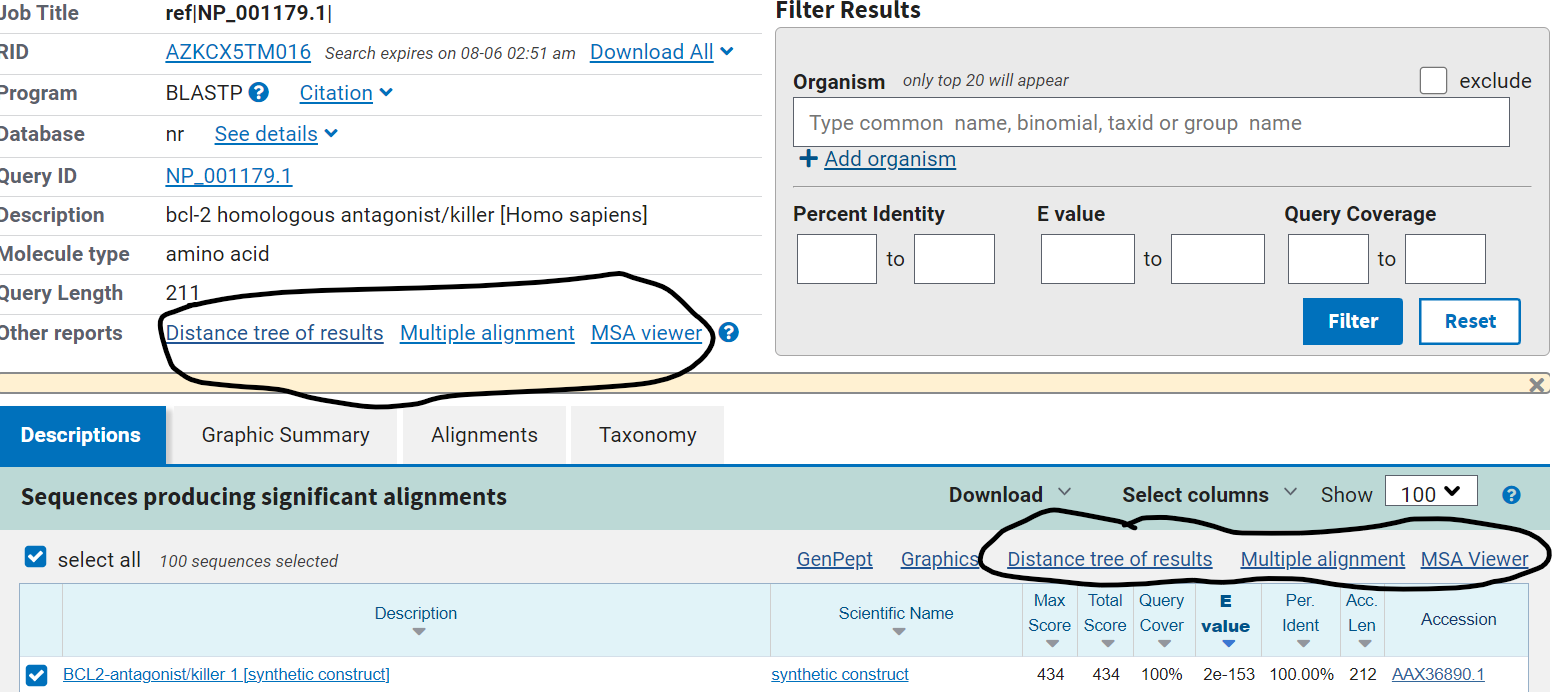
A web-BLAST output report has multiple options for viewing your results. Two of these options that allow you to take a closer look at your results and customize your views are NCBI Tree Viewer and Multiple Sequence Alignment (MSA) Viewer. Here is a relevant snippet of the results page, a protein BLAST search using accession NP_001179.1 as input against the NR protein database:
Tree Viewer:
NCBI Tree Viewer (TV) is the graphical display for phylogenetic trees. TV can visualize trees in Newick, Nexus, and ASN formats. To start using Tree Viewer go to the application homepage and look at some examples and demos. Here is the tree for the BLAST search above: 
The following actions can be performed with a tree:
- Zooming and navigation
- Displaying in different layouts
- Selecting branches and viewing selections
- Collapsing/Expanding branches
- Customizing labels
- Rooting at midpoint and Re-rooting at nodes
- Uploading/Downloading phylogenetic tree files
- Creating PDF
For more information, check out the Frequently Asked Questions page or browse through video tutorials, web tutorials, or manuals.
MSA Viewer:
Multiple Sequence Alignment Viewer application (MSA) is a web application that visualizes sequence (nucleotide or protein) alignments created by programs such as MUSCLE or CLUSTAL, including alignments from NCBI BLAST results. Users can also upload and view their own alignment files in alignment FASTA or ASN format. The MSA home page includes a links to sample protein and DNA alignment sessions. We also recommend going through the Guide.
Here is what the result MSA view looks for our sample BLAST result: 
Examples of various other alignment styles:
- Protein alignment with no anchor set
- Protein alignment, anchor set to ACI28628
- Protein alignment using FASTA format from the MUSCLE program
- Nucleotide alignment from Blast RID with query set as anchor; primate genomic, mRNA, and BAC sequences
Like Sequence Viewer, both Tree Viewer and MSA Viewer can be embedded into your own projects!
Viewing Structures in iCn3D
Overview
The amount of biomolecular structure data produced by researchers is growing rapidly and helping push scientific discovery. Knowledge of biomolecular structure helps scientists understand how the structure works and this knowledge can be used to influence function, predict binding partners, and understand biological pathways. As such, researchers in life sciences can benefit from an increased understanding of biomolecular structure and resources that build upon structural data, which is the focus of this workshop.
What is iCn3D?
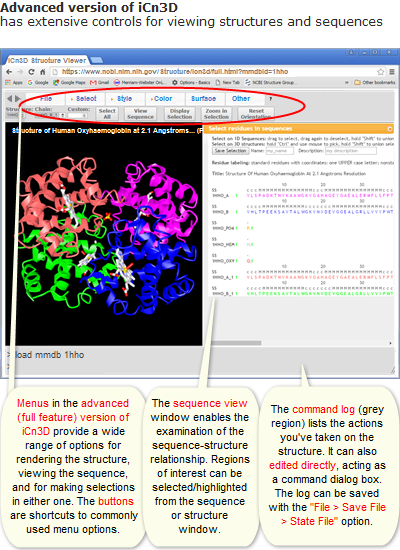
"I see in 3D" (iCn3D) Structure Viewer is not only a web-based 3D viewer, but also a structure analysis tool interactively or in the batch mode using NodeJS scripts based on the npm package icn3d. iCn3D synchronizes the display of 3D structure, 2D interaction, and 1D sequences and annotations. Users' custom display can be saved in a short URL or a PNG image. The web-based nature of the tool means no downloads are needed to start visualizing and learning!
iCn3D
Why do people use iCn3D? Just a few options:
- Create custom 3D images for publications or educational materials
- Highlight important features like active site residues, point mutations, and binding partners
- Analyze the effects of genetic mutations on protein structure
- Compare experimentally-derived and prediced protein structures
- Interactively view 3D alignments of similar structures
- Incorporate iCn3D into your own pages
- And MUCH, MUCH more
Some iCn3D features of interest:
- iCn3D can export sharable links (https://structure.ncbi.nlm.nih.gov/icn3d/share.html?XCxR6fSTmXHxR3o1A)
- iCn3D supports command-line analysis with either Python scripts (https://github.com/ncbi/icn3d/tree/master/icn3dpython) or Node.js scripts (https://github.com/ncbi/icn3d/tree/master/icn3dnode)
- iCn3D can also be used in Jupyter Notebook (https://pypi.org/project/icn3dpy)
- 3D printing
- Annotate and align AlphaFold structures
- Create contact map
- Precalculated symmetry
- Symmetry dynamically
- Electron density map
- EM map
- Transmembrane protein
- Solvent Accessible Area
- VR and AR views!
A comparison with other tools: 
a: iCn3D aligns structures (PDB or AlphaFold) based on structures or sequences.
b: iCn3D sharable links could be a short URL or a URL containing the address of an iCn3D PNG Image
c: iCn3D supports command-line analysis with either Python scripts or Node.js scripts
d: iCn3D can also be used in Jupyter Notebook
Tutorials and help documents are available here.
Here are just a few exciting things you can visualize: See full gallery here
Covid-19 related examples: 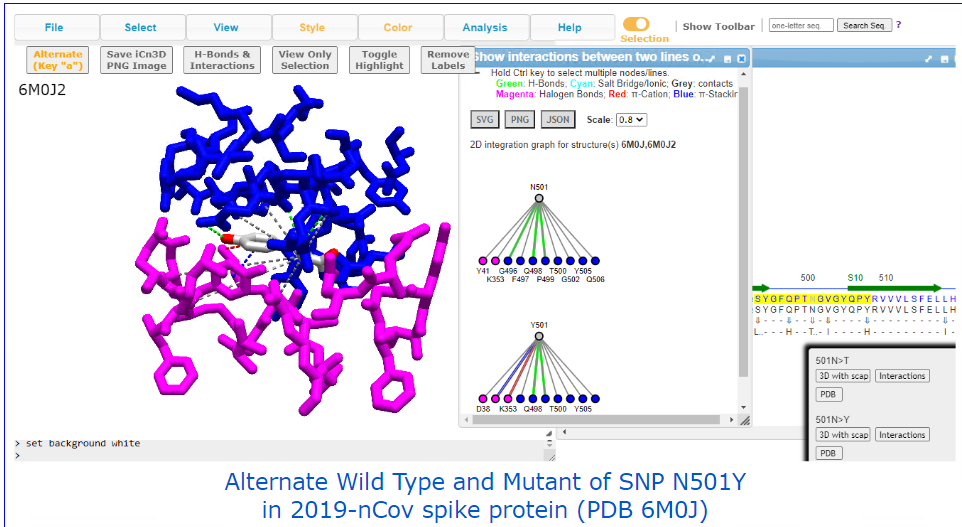
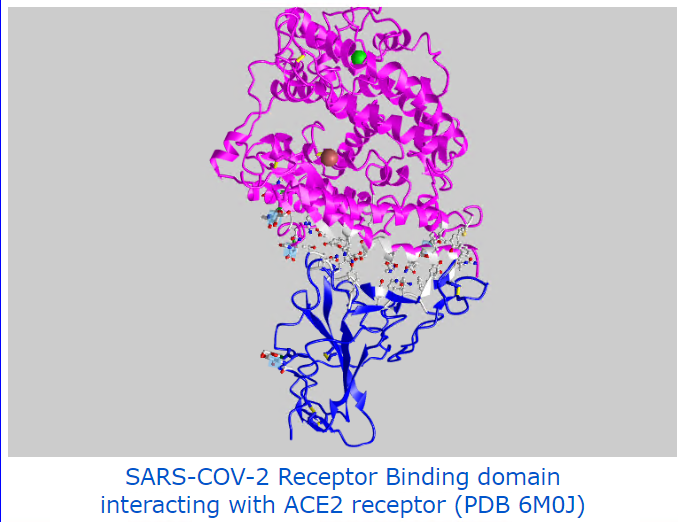
AlphaFold-related examples: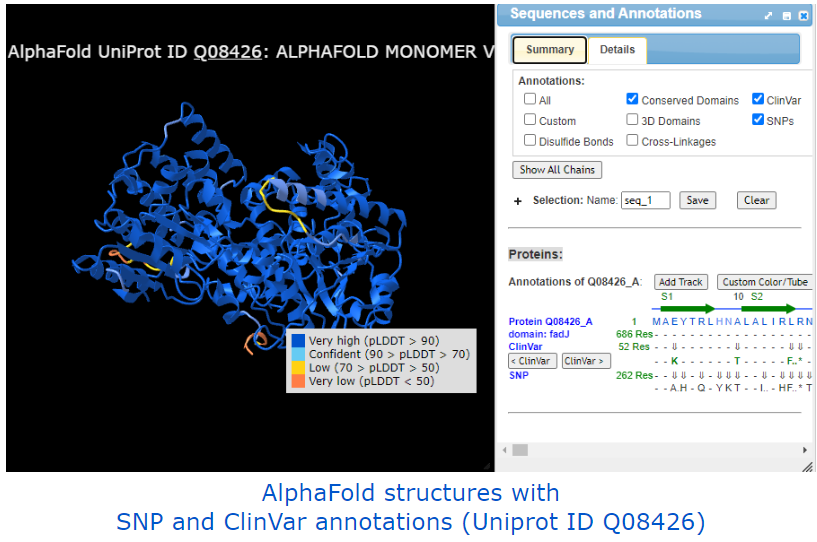
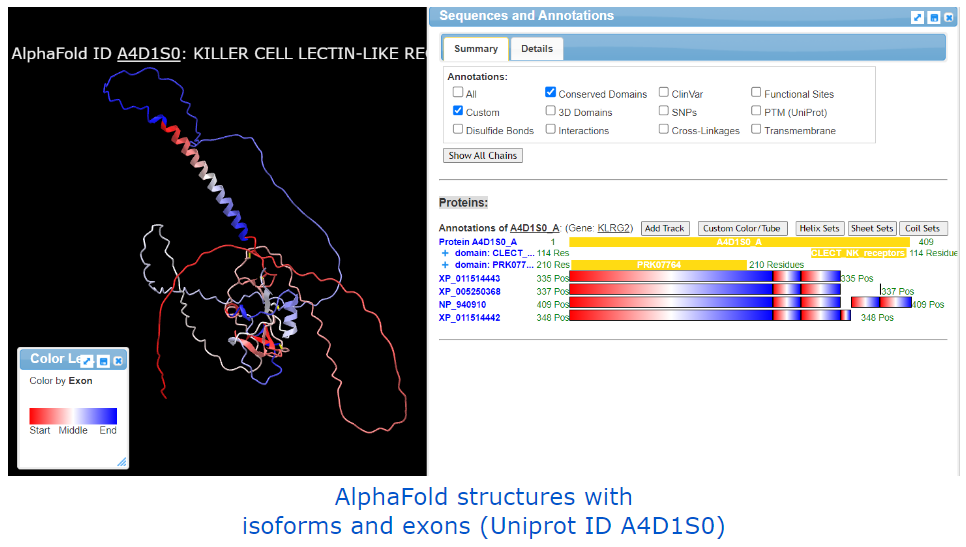
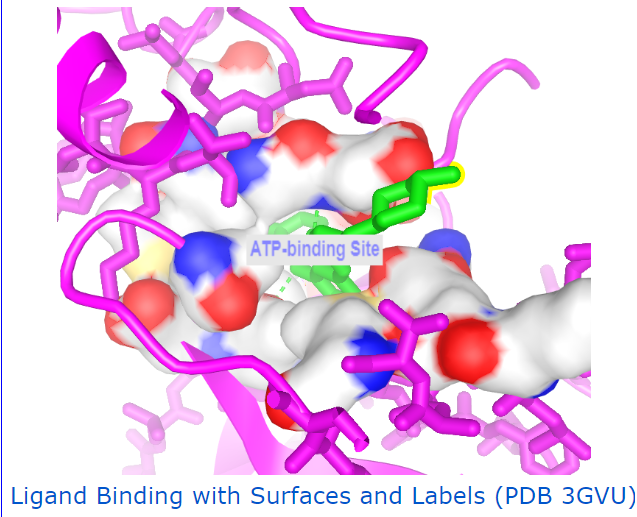
Other useful examples: 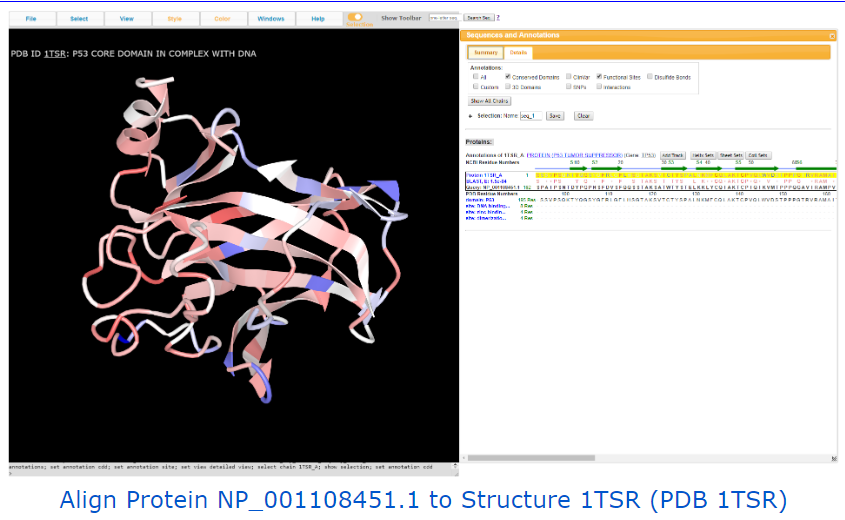
Last Reviewed: August 4, 2024

